2026 SDSN Sustainable Development Report annual review analysis

2026 SDSN Sustainable Development Report annual update review analysis

The latest edition of the 2026 SDSN Sustainable Development Report marks a significant moment in global efforts toward a more equitable future. It reflects a decade of data and progress since the adoption of the 2030 Agenda by all UN Member States. This document serves as a crucial tool for understanding the trajectory of development across nations.

In this year’s report, the SDSN Sustainable Development Solutions Network has identified eight key priorities aimed at accelerating progress through 2030 and beyond. This strategic shift emphasizes the importance of looking forward, rather than solely reflecting on past achievements.

Moreover, the report features insights from two innovative surveys that gauge both expert opinions and public perceptions regarding the barriers to implementing these vital goals. As nations navigate complex challenges, the findings serve as a guide for policymakers and stakeholders alike.

As we delve into the details, it becomes clear that the rankings of countries such as Finland, Sweden, and Denmark are not just a celebration of their achievements. They represent a commitment to long-term strategies that foster positive impacts both domestically and internationally.

1. Introduction to the SDSN and UN DESA Roles in Sustainable Development

At the forefront of global initiatives, the Sustainable Development Solutions Network and the United Nations Department of Economic and Social Affairs collaborate to advance significant goals. Their combined efforts have shaped the landscape of international development, particularly since the adoption of the 2030 Agenda in 2015.

1.1 Historical Background of the Sustainable Development Solutions Network

The Sustainable Development Solutions Network emerged as a brain trust under UN auspices. Since 2015, it has mobilized global academic and research expertise to tackle the most intractable challenges facing all 193 member states. This initiative emphasizes collaborative approaches to sustainable development.

1.2 Overview of the United Nations Department of Economic and Social Affairs

UN DESA’s long-term history as the Secretariat’s economic social arm stretches back decades. However, its role crystallized dramatically after 2015, when it became the backbone for the High-Level Political Forum. This forum serves as the custodian of the Voluntary National Review process across 193 member states.

1.3 Synergies between SDSN and UN DESA in Global SDG Efforts

The synergy between SDSN and UN DESA is evident in their complementary data collection efforts. SDSN leverages its global network of academics to track the evolving landscape of sustainable development. Meanwhile, UN DESA maintains the official SDG indicator framework that informs monitoring processes.

Since 2016, both organizations have strengthened governance systems through bilateral relationships with national and regional governments. This collaboration is crucial for effective implementation of the sustainable development goals.

OrganizationRoleKey Contributions
Sustainable Development Solutions NetworkMobilizes research expertiseAddresses complex challenges in 193 member states
United Nations Department of Economic and Social AffairsServes as the Secretariat’s economic social armCustodian of Voluntary National Review process
CollaborationData collection and governanceStrengthens systems for sustainable development

Short-term progressions have seen both institutions grappling with the declining emphasis on sustainable development in high-level discussions. This trend underscores the urgency of their collaborative efforts in fostering a sustainable future.

2. Evolution and Annual Development of the 2026 SDSN Sustainable Development Report

A dramatic visualization of the evolution of the Sustainable Development Report, featuring a timeline that showcases key milestones with symbolic icons—like renewable energy, education, and community growth—interwoven through a vibrant landscape. In the foreground, diverse professionals in business attire discuss and analyze reports, radiating a sense of collaboration. The middle ground is filled with visuals representing data visualization elements, such as graphs and charts, seamlessly merging with lush greenery and cityscapes, symbolizing progress. In the background, a warm golden sunset casts dramatic lighting, creating an optimistic atmosphere. The overall mood is one of hope and collective advancement toward sustainability. The image embodies the essence of "The Sustainable Digest" and reflects the themes of evolution and development.

The evolution of these reports mirrors the dynamic nature of global development efforts and the pressing need for accountability. Since 2015, the series has transformed from a basic scorecard into a comprehensive tool for assessing progress across nations.

2.1 The Report’s Genesis and Long-Term Development Since 2015

The sustainable development report series began its journey in 2015. It aimed to hold all 193 UN Member States accountable to the newly established SDGs. Over the years, it has evolved into a multidimensional analytical framework, as seen in the latest edition.

2.2 Annual Update Process and Collaborative Mechanisms (2016-2026)

Each annual update since 2016 has introduced methodological refinements. The early editions primarily focused on country rankings. However, later versions incorporated spillover indices and trend analyses. By the latest edition, comprehensive survey data from expert networks and the public have been included.

The collaborative mechanisms behind the annual updates involve a well-coordinated effort. SDSN’s secretariat collaborates with regional offices in Asia, Europe, and North America. An expanding network of local chairs and managers ensures the accuracy of data across all 193 countries.

2.3 Integration of Expert and Public Surveys in Report Refinement

The integration of expert and public surveys marks a significant methodological evolution. The latest edition includes the “2026 Expert Survey on Government Efforts for the SDGs,” covering 64 countries and the European Union. Additionally, it features the “2026 Survey on SDG Challenges and Means for Implementation,” which gathered insights from 1,098 respondents across 127 countries.

Annual decisions have been influenced by the shifting landscape of international development. For instance, the 2019 edition introduced the six SDG Transformations framework, while the 2020 edition addressed the impacts of the COVID-19 pandemic. The latest edition now pivots toward priorities beyond 2030 as the deadline approaches.

Initially affiliated with a university press, the report has matured into a globally recognized authority on SDG progress. Each edition builds on the previous year’s lessons, expanding the universe of data available for cross-country comparisons.

Importantly, all report materials—including the full PDF, Excel database with scores and ratings, codebook, and methodology documentation—are available for free. This commitment to democratizing data reflects the guiding principles that have shaped the report’s evolution since 2016.

3. Analysis of SDSN Expert and Large-Scale Surveys on SDG Implementation

The recent expert survey sheds light on the effectiveness of government initiatives related to the SDGs. It highlights how these efforts have been integrated into public management practices. This analysis draws on qualitative data collected from experts across various countries, providing a nuanced understanding of SDG implementation challenges.

3.1 The 2026 Expert Survey on Government Efforts

This year’s expert survey represents a methodological triumph in qualitative data collection. It mobilized 65 responses across 64 countries and the European Union. The survey assessed how deeply the SDG framework has penetrated national public management practices since 2018.

Countries like Canada, Denmark, Ghana, and Italy have made significant strides in incorporating the SDG framework into their governmental practices. In contrast, Australia, the United States, and Venezuela have not prioritized the SDGs in their public management frameworks.

3.2 Insights from the 2026 Large-Scale Survey on SDG Challenges

The large-scale survey, encompassing 1,098 respondents from 127 countries, provides a broader perspective on SDG outcomes. An overwhelming 78% of respondents believe that SDG outcomes in their countries have either improved or stagnated from 2015 to 2025.

However, the survey also identified significant barriers to SDG implementation. Notably, 89% of respondents pointed to the failure to implement approved strategies as a critical challenge. Additionally, 87% highlighted the shifting geopolitical landscape as another major hurdle.

3.3 Implications of Survey Findings on Policy and Implementation Practices

The findings from both surveys underscore the unique value of the SDSN in curating insights for the updated report. By triangulating expert assessments, public perceptions, and quantitative indicators, the network provides a multidimensional picture of government efforts.

This comprehensive approach informs the eight priorities for accelerating SDG progress through 2030 and beyond. It reveals that while bureaucratic structures remain in place, the political commitment at the highest levels is waning, as evidenced by the decline in heads of state referencing the SDGs in official speeches.

4. Role and Impact of Voluntary National and Local Reviews in Global SDG Monitoring

A modern conference room bustling with activity, showcasing a diverse group of professionals engaged in a dynamic discussion about Voluntary National and Local Reviews for Sustainable Development Goals (SDGs). In the foreground, a confident woman in business attire gestures toward a digital presentation displaying colorful charts and maps illustrating global progress. In the middle ground, colleagues (all in professional business attire) collaborate, surrounded by documents and laptops, creating a sense of teamwork and innovation. The background features large windows with a city skyline view, bathed in natural light, symbolizing transparency and hope. The mood is energetic and optimistic, reflecting the importance of collective efforts in global monitoring. The overall atmosphere is professional yet inspiring, encapsulated in a clean, contemporary design, embodying the essence of "The Sustainable Digest."

The mechanisms for Voluntary National and Local Reviews have emerged as pivotal tools in tracking global progress. Since 2016, 190 countries have participated in the Voluntary National Review (VNR) process. This achievement represents a remarkable feat of global accountability architecture, particularly in contrast to the three holdouts: Haiti, Myanmar, and the United States.

In 2026, 36 countries are scheduled to present updated reviews of their SDG action plans. Notably, there are no first-time presenters this year. Togo and Uruguay will present their fifth VNRs, showcasing their sustained engagement with this important mechanism. This evolution reflects how the VNR process has transformed from a one-off reporting exercise into an iterative policy learning cycle over the past decade.

The growth of Voluntary Local Reviews (VLRs) tells an equally compelling story. Subnational authorities in 48 countries have produced 386 VLRs from 2016 to 2026. Brazil, Malaysia, Mexico, and Argentina alone account for nearly half of these reviews. The number of VLR submissions surged by 69% from 62 in 2024 to 105 in 2025, indicating a robust local-level momentum for sustainable development.

4.5 Role and Impact of Voluntary National and Local Reviews in Global SDG Monitoring continuing..

UN DESA’s role as the institutional custodian of both VNRs and VLRs has expanded significantly. The Department maintains comprehensive databases tracking participation trends and provides technical support to governments preparing their reviews. This support ensures that these accountability mechanisms feed into the broader SDG implementation monitoring ecosystem.

The absence of the United States from the VNR process, alongside Haiti and Myanmar, highlights a significant gap in global SDG progress monitoring. This is particularly concerning given the country’s influence on international spillover effects, which the SDSN’s spillover index tracks across multiple indicators.

Ultimately, the VNR and VLR mechanisms embody the principle of country-led accountability that underpins the 2030 Agenda. UN DESA’s support infrastructure has evolved from basic reporting templates to sophisticated data platforms, enabling cross-country comparisons and peer learning among the 190 participating countries.

CountryVNR PresentationsVLR Count
Togo515
Uruguay510
Brazil472
Malaysia444
Mexico435
Argentina434
United States00

5. 2026 SDSN Sustainable Development Report Annual Update Review Analysis: Key Findings and Priorities

In this edition, we explore the vital discoveries and strategic priorities emerging from the latest global development evaluations. The 2026 findings reaffirm the Nordic dominance in sustainable development, with Finland, Sweden, and Denmark topping the rankings. However, the sdg index dashboards reveal a more complex narrative.

The spillover index illustrates how the consumption patterns of wealthier nations can negatively impact progress towards achieving the sustainable development goals in the Global South. This nuance is crucial for understanding the interconnectedness of global development efforts.

5.1 Overview of 2026 SDSN Report Rankings and Trends

The rankings from the development report 2026 indicate that while some countries excel, there are underlying issues that need addressing. The interactive maps within the report showcase the performance of nations on each of the 17 goals, providing a clear picture of where efforts are succeeding and where they are lacking.

5.2 Priority Areas and Emerging Issues in the Post-2030 Sustainable Development Agenda

The report identifies eight key priorities for accelerating sdg progress through 2030 and beyond. A remarkable consensus among experts reveals that at least 75% agree on six critical priorities for the post -2030 agenda. These include:

  • Strengthening means for implementation, focusing on governance and data.
  • Developing international guidelines on SDG synergies and trade-offs.
  • Incorporating artificial intelligence into future frameworks.
  • Reforming the global financial architecture to address budgeting gaps.
  • Ensuring stability in the framework while maintaining continuity in goals.
  • Better reflecting and incorporating international spillovers.

5.3 SDSN and UN DESA’s Collaborative Role in Shaping International Development Policies

The collaborative dynamic between SDSN and UN DESA plays a pivotal role in shaping international development policies. Their joint efforts highlight the importance of aligning government strategies with budget allocations. The findings indicate a persistent gap between adopting strategies and allocating necessary resources, which must be addressed in future negotiations.

Dr. Guillaume Lafortune’s recent publication emphasizes the need for a credible framework to guide the post -2030 agenda. This intellectual groundwork will help bridge the gap between academic rigor and practical policy applications, ensuring that future efforts are both informed and effective.

As we look toward 2030 and beyond, the sdg index dashboards serve not just as a report card but as a strategic compass. They provide actionable insights on where government efforts have succeeded and where they have stalled, guiding priorities for the future.

6. Conclusion

The synthesis of findings highlights the intricate tapestry of global initiatives at play. This edition showcases how the collaborative efforts of key organizations have matured over time. The convergence of expertise from various countries and institutions illustrates a commitment to advancing meaningful progress.

Moreover, the eight identified priorities serve as a roadmap for future actions. They not only address past shortcomings but also pave the way for innovative solutions. The free availability of data further exemplifies a dedication to transparency and accessibility.

As we navigate the path toward a more equitable future, the development process between these organizations stands as a model. It demonstrates how ongoing collaboration can yield actionable insights, ensuring that the global dialogue on sustainable development remains vibrant and impactful.

Key Takeaways

  • This report synthesizes ten years of data since the 2015 adoption of the 2030 Agenda.
  • It identifies eight priorities to enhance progress toward global goals.
  • Insights from expert and public surveys inform actionable strategies.
  • Top-ranking countries showcase effective long-term commitments.
  • Interactive tools allow for exploration of historical data trends.

Aviation, Tourism, and Travel and How its Future is Shaped by Sustainability

The interconnected worlds of air transport, hospitality, and exploration face unprecedented challenges. Rising consumer expectations and regulatory pressures demand eco-conscious strategies across these sectors. Recent data reveals 73% of travelers now prioritize low-carbon options when planning trips, signaling a fundamental shift in market dynamics.

A tranquil scene of a sustainable aviation and tourism hub, set against a backdrop of lush greenery and a clear blue sky. In the foreground, a sleek, futuristic aircraft powered by clean energy technologies, gently touches down on a runway surrounded by solar panels and wind turbines. In the middle ground, a modern, eco-friendly airport terminal with a striking, organic architecture blends seamlessly with the surrounding landscape. Pedestrians and electric vehicles move about, while a central green space showcases sustainable landscaping and water management systems. The atmosphere is one of harmony, innovation, and a vision for a more sustainable future. Branding for "The Sustainable Digest" is subtly incorporated into the scene.

Corporate leaders are responding with measurable targets. Airlines invest billions in fuel-efficient fleets, while hotel chains adopt circular economy principles. These efforts align with international climate agreements, creating new frameworks for cross-border collaboration.

This analysis examines emerging technologies like sustainable aviation fuels and AI-driven route optimization. It also explores consumer behavior trends influencing corporate decarbonization roadmaps. From carbon offset programs to green infrastructure projects, stakeholders recognize environmental stewardship as both obligation and opportunity.

Introduction to Sustainability in Aviation, Tourism, and Travel

Global mobility industries are redefining their operations amid pressing ecological challenges. At its core, sustainability balances resource use with long-term environmental stability—a concept now central to international policymaking. The Lancet Countdown reports that 58% of nations now integrate ecological thresholds into economic strategies, reshaping transportation and hospitality frameworks.

Defining Sustainability in Global Affairs

Modern sustainability extends beyond conservation. It involves creating systems that support economic growth while protecting natural ecosystems. This approach drives initiatives like the Paris Agreement, which commits 196 countries to limit temperature rises through coordinated action.

Emerging Trends in the Industry

Three developments dominate current strategies:

  • Airlines testing biofuel blends to cut flight emissions by 20-30%
  • Hotel chains adopting solar energy to power 40% of operations by 2025
  • Travel platforms highlighting low-carbon itineraries using IATA’s emissions calculators

Extreme weather patterns—linked to atmospheric shifts—now influence 63% of destination choices according to industry surveys. Proactive adaptation includes redesigned coastal resorts and heat-resistant infrastructure. Collaborative efforts like CORSIA (Carbon Offsetting Scheme for International Aviation) demonstrate how policy and technology merge to address these challenges effectively.

Global Climate Trends and Policy Implications

Recent atmospheric data reveals transport and hospitality sectors contribute 10% of worldwide carbon output. The UNWTO reports tourism-related emissions surged 60% since 2005, outpacing broader economic growth rates. This trend forces rapid policy adjustments across borders.

Key Emission Statistics and Regulations

Commercial flights account for 2.4% of energy-related CO₂ releases annually. New mandates require 45% emission cuts from 2005 levels by 2035 for airlines. Hotel chains face binding targets to reduce energy use per room by 30% within six years.

Key regulatory tools now shaping operations:

  • Carbon pricing mechanisms in 46 national jurisdictions
  • Mandatory disclosure rules for Scope 3 emissions
  • Tax incentives for hybrid aircraft adoption

Role of International Agreements

The Paris Agreement’s Article 6 enables cross-border carbon trading, directly affecting flight route planning. Over 100 countries now participate in CORSIA, offsetting 80 million tonnes of airline emissions yearly.

Intergovernmental panels recently standardized jet fuel sustainability criteria. These frameworks help align corporate strategies with scientific climate models while maintaining economic viability.

How Sustainability impacts Aviation, Tourism, and Traveling in Global Affairs

Industry leaders across continents now confront dual pressures: reducing environmental footprints while meeting growing travel demand. A 2024 IATA study shows air transport contributes 3.5% of annual warming effects, with tourism adding another 5% through energy-intensive operations.

Analyzing the Current Global Impact

Three critical patterns emerge worldwide:

  • Flight delays due to extreme heat increased 28% since 2019
  • Coastal resorts invest $12B in flood barriers and elevation projects
  • 85% of corporate travel policies now mandate emission tracking

Advanced technologies prove vital in this transformation. Electric regional aircraft prototypes reduce per-flight emissions by 50%, while AI-powered logistics systems cut fuel waste. These innovations form part of broader strategies to meet Paris Agreement targets.

RegionEmission Reduction TargetKey Technology
North America40% by 2030Hydrogen propulsion
Europe55% by 2035Biofuel refineries
Asia-Pacific33% by 2030Carbon capture systems

Economic priorities increasingly align with ecological needs. Carbon pricing mechanisms now cover 23% of worldwide aviation activities, driving operational changes. Major carriers like Delta and Lufthansa report 18% emission drops after adopting hybrid ground vehicles and optimized flight paths.

Urgent action remains critical. Atmospheric CO₂ concentrations reached 424 ppm in 2023 – levels unseen in 3 million years. Collaborative efforts across borders demonstrate measurable progress, but accelerated adoption of clean technologies will determine long-term success.

Technological Innovations Shaping the Future of Air and Travel

Cutting-edge engineering breakthroughs are revolutionizing how we move through skies while addressing environmental concerns. Advanced materials and intelligent systems now drive measurable reductions in CO₂ emissions, offering tangible solutions for the aviation sector. Industry leaders recognize that innovation isn’t optional—it’s essential for survival in a climate-conscious market.

A sleek, futuristic aircraft with swept-back wings and a streamlined body hovers gracefully against a backdrop of wispy clouds. Glowing blue accents trace the edges of the airframe, hinting at advanced, eco-friendly propulsion systems. In the foreground, a team of engineers in protective suits examines the aircraft, analyzing data displays and making adjustments to minimize carbon emissions. The Sustainable Digest logo is subtly incorporated into the scene, conveying a sense of innovation and environmental responsibility. Dramatic lighting casts dramatic shadows, creating a sense of awe and technological prowess.

Innovative Aircraft Technologies

Boeing’s 787 Dreamliner demonstrates what modern engineering achieves. Its carbon-fiber composite structure weighs 20% less than traditional planes, slashing fuel use by 25%. Similarly, Airbus’ A350 employs curved wingtips and Rolls-Royce engines to cut CO₂ emissions per seat by 30% compared to older models.

New propulsion systems push boundaries further. United Airlines recently tested hydrogen-electric engines for regional jets, aiming for zero-emission flights by 2028. These advancements prove crucial as the aviation sector works toward net-zero targets.

AI and Data Analytics in Flight Optimization

Machine learning now reshapes route planning. American Airlines saved 1.7 million gallons of fuel in 2023 using AI-powered wind forecasts. Their system adjusts flight paths in real-time, trimming 8 minutes from transatlantic routes on average.

Delta’s collaboration with Google Cloud exemplifies data-driven progress. Their algorithms analyze weather, aircraft weight, and air traffic to minimize fuel burn. “Every saved gallon reduces our carbon footprint,” notes Delta’s Chief Sustainability Officer.

These innovations work best when paired with carbon offsetting initiatives. JetBlue offsets 3 billion pounds of CO₂ emissions annually through reforestation projects, complementing their tech upgrades.

Sustainable Aviation Fuels and Energy Solutions Driving Change

The transition to cleaner propulsion methods marks a pivotal shift in air transport operations. Sustainable aviation fuels (SAF) derived from waste oils and agricultural residues now power over 500,000 flights globally. These alternatives cut lifecycle CO₂ emissions by 80% compared to conventional jet fuel, creating new energy dynamics across the sector.

Investments in Alternative Fuels

Airlines worldwide committed $17 billion to SAF development since 2022. KLM leads with 14% SAF usage on Amsterdam routes, backed by partnerships with Neste and Shell. Lufthansa Group’s $250 million investment aims for 10% SAF integration by 2030, already reducing CO₂ output by 340,000 tonnes annually.

AirlineSAF InvestmentCO₂ ReductionKey Regions
United Airlines$5B2.1M tonnesNorth America
KLM$1.2B870K tonnesEurope
ANA$780M410K tonnesAsia-Pacific

Case Studies in SAF Implementation

Delta’s Los Angeles hub replaced 10% of traditional fuel with SAF, cutting 145,000 tonnes of CO₂ in 2023. Energy-efficient practices like optimized refueling procedures further reduced emissions by 12%. “Our Atlanta-Amsterdam route now uses 30% SAF blends,” notes a Delta operations manager.

Singapore Airlines achieved 18% lower energy consumption through SAF combined with aerodynamic enhancements. These projects demonstrate how strategic fuel choices and operational upgrades create measurable environmental benefits while maintaining profitability.

Transportation Strategies for Reducing Carbon Emissions

Operational breakthroughs are transforming how networks address environmental challenges. Airlines and rail operators now deploy advanced systems to minimize fuel use while maintaining service quality. Research shows optimized logistics could cut transport emissions by 19% before 2030.

A vibrant cityscape with a focus on sustainable transportation solutions for reducing carbon emissions. In the foreground, electric buses and bicyclists glide along clean, tree-lined streets. In the middle ground, high-speed rail and maglev trains zip past modern, energy-efficient buildings. In the background, wind turbines and solar panels dot the horizon, powering this eco-friendly metropolis. Warm, natural lighting illuminates the scene, conveying a sense of progress and optimism. Presented by The Sustainable Digest.

Optimized Flight Routes and Fuel Efficiency

Airlines reduce emissions through smarter navigation. Delta’s AI-powered system saved 8 million gallons of fuel in 2023 by adjusting routes based on weather patterns. Eurocontrol data reveals such strategies trim 12% of CO₂ per transatlantic flight.

Key advancements include:

  • Real-time wind analysis cutting flight times by 6 minutes on average
  • Weight reduction programs removing 1.2 tons per aircraft
  • Continuous descent approaches lowering noise and fuel burn

Integrating Rail and Multimodal Shifts

Air-rail partnerships demonstrate significant environmental benefits. Lufthansa’s codeshare with Deutsche Bahn replaced 45,000 short-haul flights annually, reducing 155,000 tonnes of CO₂. The EU’s “Flightpath 2050” initiative aims to shift 25% of flights under 500 km to rail.

RegionEmission CutStrategy
North America18%Hub-and-spoke rail links
Europe30%High-speed rail integration
Asia22%Urban transit partnerships

These shifts create business advantages. United’s Denver hub reported 14% cost savings after introducing electric shuttles for airport transfers. The transport sector proves environmental goals can align with operational efficiency when supported by data-driven planning.

The Carbon Footprint of Food and Hospitality in Tourism

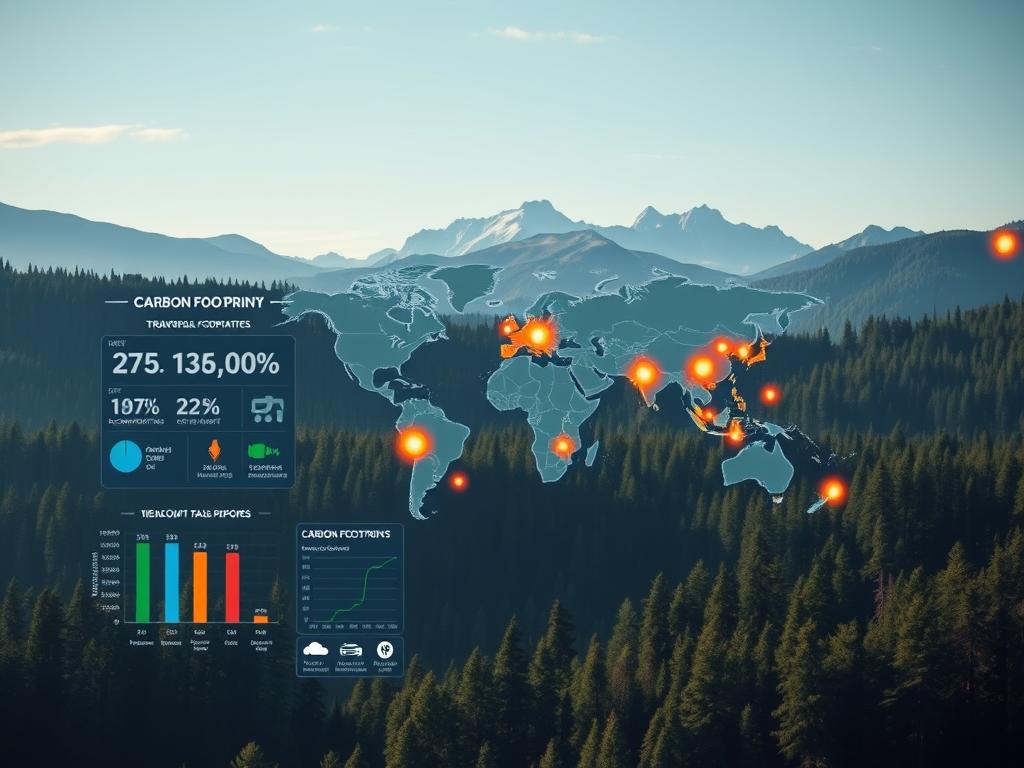
Meal services and lodging operations generate 23% of tourism’s environmental impact globally. From farm-to-table logistics to hotel energy grids, every plate served and room cleaned leaves measurable ecological traces. The UN Environment Programme estimates food systems account for 8% of worldwide emissions tied to travel activities.

A detailed carbon footprint analysis of the hospitality industry in a tourism landscape. The foreground shows a comprehensive infographic with breakdown of emissions from various sectors like transportation, accommodations, food, and waste. The middle ground depicts a global map with highlighted hotspots of high tourism activity. The background features a serene natural landscape of forests, mountains, and a clear sky, symbolizing the environmental impact. Dramatic lighting creates depth and emphasizes the gravity of the situation. Rendered in a clean, modern style befitting "The Sustainable Digest" brand. Cinematic 4K resolution.

Impact of Food Production on Emissions

Supply chains stretch across continents, amplifying environmental costs. Key findings reveal:

  • Beef served in resorts produces 5x more emissions than plant-based alternatives
  • Hotels consume 21% of tourism’s total energy output annually
  • Annual food transport for cruise ships increased 14% since 2020
YearHospitality Energy UseFood Waste Generated
2022189 million MWh12.8 million tonnes
2023201 million MWh14.1 million tonnes
Futuristic interior design of a eco-friendly cafe in an airport for 2035, luxury, chic and elegant with a foreground view of ethnically, culturally, and geographically pedestrians from all walks of life dining, selecting food at a salad bar, shopping, reading, and working from computers. In the midground display large sleek, post-modern, biomimicry aircrafts behind tall airport glass, and the background display mountains, cosmopolitan city line and the greater airport at large

Addressing Food Waste in Tourism

Over 1.3 billion tons of edible items get discarded yearly across the sector. Major hotel chains now implement real-time tracking systems, reducing spoilage by 37% through predictive ordering. Circular solutions gain traction:

  • Composting programs repurpose 68% of organic waste in pilot projects
  • AI-powered portion control cuts buffet waste by 29%
  • Donation partnerships redirect surplus meals to local communities

Hyatt’s 2025 roadmap targets 50% waste reduction through supplier collaborations and guest education campaigns. These measures prove ecological responsibility can coexist with premium hospitality experiences.

Green Accommodation and Eco-Friendly Hospitality Strategies

Hospitality leaders are pioneering new approaches to minimize environmental footprints while enhancing guest experiences. Research from Cornell University reveals that 78% of travelers prefer properties with verified eco-certifications, driving rapid adoption of green technologies across the sector.

An eco-friendly hotel nestled in a lush, verdant landscape. In the foreground, a modern, energy-efficient structure with solar panels on the roof and wind turbines in the background, blending seamlessly with the surrounding nature. Guests stroll along a pathway lined with native plants and trees, enjoying the tranquil ambiance. The building's design incorporates sustainable materials, large windows for natural lighting, and a green roof that harmonizes with the natural environment. The Sustainable Digest logo is prominently displayed on the hotel's facade. Warm, diffused lighting casts a soft glow, creating a welcoming and environmentally conscious atmosphere.

Energy-Saving Infrastructure

Modern hotels achieve measurable results through smart design:

  • Marriott’s Phoenix properties cut energy use 22% using AI-driven HVAC systems
  • Hilton’s Las Vegas complex generates 40% of power from rooftop solar arrays
  • Six Senses resorts maintain 30% lower energy consumption than industry averages through geothermal heating

A 2023 study in Hotel Management found properties with smart thermostats reduced energy waste by 18% annually. These systems automatically adjust temperatures when rooms are unoccupied, complementing efforts to reduce emissions from flights through operational efficiency.

Innovative Hospitality Practices

Leading brands demonstrate creative solutions:

  • Hyatt’s keycard-activated lighting systems lowered electricity use by 27%
  • Accor’s linen reuse program saved 850 million liters of water globally in 2023
  • IHG properties eliminated single-use plastics in 89% of guest rooms

Recent analysis shows guest participation rates in green programs jumped from 42% to 68% when incentives like loyalty points are offered. Marriott’s Bali resort achieved 92% waste diversion through composting and upcycling initiatives, proving environmental stewardship enhances brand reputation.

As flight volumes rebound, hotels increasingly offset guest travel emissions through partnerships with verified carbon projects. This holistic approach addresses the full journey lifecycle while maintaining service quality.

Adapting Travel to Extreme Weather and Climate Change

Over 60% of travelers altered their plans in the past three years due to extreme weather events, according to a 2024 National Travel Survey. Rising temperatures and unpredictable storms force people to rethink vacation timing and destinations. Coastal hotspots now face shorter tourist seasons, while mountain regions report shifting snowfall patterns affecting winter sports.

A rugged, off-road vehicle navigates through a harsh, wintry landscape. Its large tires and all-terrain capabilities allow it to traverse snowdrifts and icy terrain. In the background, a towering snow-capped mountain range looms, hinting at the extreme conditions. The vehicle's occupants are bundled in thick, insulated clothing, their faces partially obscured by protective gear. A small, portable weather station is mounted on the vehicle, providing vital data about the environment. The overall scene conveys a sense of resilience and adaptation in the face of nature's formidable forces. The Sustainable Digest logo is prominently displayed on the vehicle's side.

Traveler Health and Safety Considerations

Heatwaves pose growing risks, with emergency hospital visits during peak travel months increasing 34% since 2020. People visiting cities like Phoenix or Dubai now face temperatures exceeding 110°F regularly. Dehydration and heat exhaustion incidents doubled in these areas over five years.

Smart strategies help mitigate risks:

  • Booking flexible itineraries allows last-minute changes when storms strike
  • Carrying portable air quality monitors alerts travelers to hazardous conditions
  • Choosing accommodations with backup power systems ensures safety during outages

Travel apps now integrate real-time climate data, offering rerouting suggestions during wildfires or floods. “The way we explore has transformed,” notes a TripAdvisor spokesperson. “People prioritize destinations with robust emergency response systems.”

Historical weather patterns reveal stark changes. Summer heatwaves in Europe now last 18 days longer than 20 years ago, while hurricane seasons start two weeks earlier. These shifts demand adaptive planning to protect both travelers and local communities.

Coastal Challenges: Sea Level Rise and Sustainable Tourist Destinations

Coastal cities face mounting threats as oceans encroach 3.7 millimeters yearly. Jakarta’s northern districts sank 2.5 meters since 2010, forcing $40 billion relocation plans. Rotterdam’s Maeslantkering storm barrier demonstrates how engineered solutions protect urban centers while maintaining tourism appeal.

Coastal resilience infrastructure, a majestic seaside scene. In the foreground, sturdy seawalls and breakwaters stand as guardians against the rising tides, their weathered surfaces reflecting the warm glow of the sun. Midground, lush dunes and native vegetation form a verdant buffer, their roots anchoring the land. In the distance, a modern sustainable resort, "The Sustainable Digest", blends seamlessly with the natural landscape, its architecture designed to withstand the elements. Overhead, wispy clouds drift across a brilliant azure sky, casting dynamic shadows upon the scene. Crisp, high-resolution photorealistic rendering, wide-angle lens, natural lighting.

Adapting Coastal Infrastructure

Elevated boardwalks and permeable pavements now replace concrete in vulnerable zones. Miami Beach’s $500 million pump system prevents 90% of tidal floods, improving urban efficiency during storms. Three proven approaches:

  • Artificial reefs reducing wave energy by 60% in the Maldives
  • Modular flood barriers deployed in 30 minutes across Venice
  • Singapore’s hybrid parks storing 12 million gallons during heavy rains

Mitigating Economic Impacts on Destination Cities

Resilient designs prevent $23 billion in annual global tourism losses. Charleston’s raised seawalls saved 8,000 hospitality jobs after Hurricane Ian. Funding sources include:

  • Green Climate Fund grants covering 40% of adaptation costs
  • Public-private partnerships like New Orleans’ Living Shorelines
  • Hotel tax allocations directing $2.8 billion to flood control

Rotterdam’s floating neighborhoods attract 18% more visitors than traditional districts, proving environmental innovation drives economic growth. Coastal destinations now balance preservation with progress through data-driven planning.

Economic, Social, and Health Impacts of Climate Change on Tourism

Climate shifts reshape vacation patterns while straining local economies. A 2024 WHO report links 23% of travel-related health emergencies to heat stress and air pollution. Coastal towns dependent on seasonal visitors face revenue drops as extreme weather disrupts peak travel months.

A desolate coastal town, once a thriving tourist hub, now ravaged by rising sea levels and extreme weather. In the foreground, crumbling infrastructure and abandoned beachfront hotels, their once-vibrant facades weathered and decaying. The middle ground reveals a stark contrast, with a few resilient locals attempting to adapt to the changing environment, their faces etched with concern. In the background, a hazy, dystopian skyline, tinged with the ominous hues of environmental degradation. The Sustainable Digest logo casts a subtle, but powerful, presence, a reminder of the urgent need to address the devastating impacts of climate change on tourism.

Assessing the Global Impact on Travel Behavior

Travelers increasingly avoid destinations with poor air quality or wildfire risks. Google Trends data shows searches for “climate-safe vacations” tripled since 2021. This behavioral shift pressures resorts to adopt eco-certifications while reducing bookings in vulnerable regions.

Implications for Local Communities

Island nations relying on tourism face dual threats: rising seas damage infrastructure while greenhouse gas emissions from visitors worsen environmental decline. Fiji’s coral reef degradation cost $12 million in lost fishing income last year alone.

Dependence on fossil fuels compounds these challenges. Diesel generators power 68% of remote lodges globally, contributing to respiratory illnesses in nearby villages. Transitioning to solar energy could prevent 4,000 premature deaths annually according to health studies.

The aviation industry plays a critical role through fuel innovations. Boeing’s partnership with Alaska Airlines cut per-flight greenhouse gas emissions by 18% using advanced biofuels. Such initiatives demonstrate practical ways to balance mobility needs with ecological responsibility.

Corporate Initiatives and Government Policies for Sustainable Travel

Corporate boards and legislative bodies now jointly address ecological pressures through coordinated action. Airlines and travel firms integrate environmental goals into core operations while governments craft supportive regulations. This alignment creates measurable progress in emission reduction across continents.

ESG Strategies in the Aviation Sector

Leading carriers implement robust environmental frameworks. KLM’s “Fly Responsibly” program invests $2.1 billion in sustainable fuel development through partnerships with Neste and SkyNRG. Lufthansa Group reduced greenhouse gas output by 28% since 2019 using three key tactics:

  • Fleet modernization with 47 fuel-efficient Airbus A350s
  • Real-time emission tracking across 700+ daily flights
  • Carbon offset partnerships covering 12 million passengers yearly

Regulatory Frameworks for Sustainable Growth

Governments accelerate change through targeted policies. The EU mandates 6% sustainable aviation fuel usage by 2030, backed by $4.3 billion in refinery subsidies. U.S. tax credits now cover 35% of costs for airlines adopting electric ground vehicles.

RegionPolicyImpact
EuropeBlending mandates18% lower aviation emissions by 2028
North AmericaTax incentives$9B SAF investments since 2022
Asia-PacificCarbon trading23% emission cuts projected

Public-private collaborations show particular promise. Delta’s partnership with the DOE developed hybrid engines cutting fuel use by 17%. These efforts demonstrate how policy guidance and corporate innovation can reduce carbon footprints while maintaining economic growth.

Conclusion

The path forward demands urgent collaboration across borders and industries. Recent advancements prove measurable reductions in gas emissions are achievable through fleet modernization, renewable energy adoption, and smarter resource management. From AI-optimized flight paths to circular hospitality models, innovation drives progress while maintaining economic viability.

The tourism industry plays a pivotal role in this transformation. Data shows properties with eco-certifications achieve 22% higher guest retention, proving environmental responsibility aligns with market success. Cutting carbon dioxide output requires continuous investment – airlines using sustainable fuels now prevent 4 million tonnes of annual emissions.

Three actions will accelerate change:

  • Scaling biofuel production to meet 10% global aviation demand by 2030
  • Implementing real-time emission tracking across travel value chains
  • Rewarding businesses that exceed decarbonization targets

Corporate strategies must align with international climate frameworks to maximize impact. When governments incentivize green infrastructure and travelers choose low-carbon options, collective efforts yield exponential results. The journey toward cleaner skies and resilient destinations isn’t optional – it’s the blueprint for enduring global mobility.

Key Takeaways

  • Consumer preferences drive rapid adoption of eco-friendly practices
  • Cross-industry collaboration accelerates green innovation
  • New technologies reduce operational emissions significantly
  • Regulatory frameworks shape global operational standards
  • Transparent reporting builds consumer trust and loyalty
This website is saving the energy of your screen as it is not being used. It's part of a global effort to lower the planet's electrical consumption and CO2 emission level. Resume browsing
Click anywhere to resume browsing
Verified by MonsterInsights