2026 SDSN Sustainable Development Report annual review analysis

2026 SDSN Sustainable Development Report annual update review analysis

The latest edition of the 2026 SDSN Sustainable Development Report marks a significant moment in global efforts toward a more equitable future. It reflects a decade of data and progress since the adoption of the 2030 Agenda by all UN Member States. This document serves as a crucial tool for understanding the trajectory of development across nations.

In this year’s report, the SDSN Sustainable Development Solutions Network has identified eight key priorities aimed at accelerating progress through 2030 and beyond. This strategic shift emphasizes the importance of looking forward, rather than solely reflecting on past achievements.

Moreover, the report features insights from two innovative surveys that gauge both expert opinions and public perceptions regarding the barriers to implementing these vital goals. As nations navigate complex challenges, the findings serve as a guide for policymakers and stakeholders alike.

As we delve into the details, it becomes clear that the rankings of countries such as Finland, Sweden, and Denmark are not just a celebration of their achievements. They represent a commitment to long-term strategies that foster positive impacts both domestically and internationally.

1. Introduction to the SDSN and UN DESA Roles in Sustainable Development

At the forefront of global initiatives, the Sustainable Development Solutions Network and the United Nations Department of Economic and Social Affairs collaborate to advance significant goals. Their combined efforts have shaped the landscape of international development, particularly since the adoption of the 2030 Agenda in 2015.

1.1 Historical Background of the Sustainable Development Solutions Network

The Sustainable Development Solutions Network emerged as a brain trust under UN auspices. Since 2015, it has mobilized global academic and research expertise to tackle the most intractable challenges facing all 193 member states. This initiative emphasizes collaborative approaches to sustainable development.

1.2 Overview of the United Nations Department of Economic and Social Affairs

UN DESA’s long-term history as the Secretariat’s economic social arm stretches back decades. However, its role crystallized dramatically after 2015, when it became the backbone for the High-Level Political Forum. This forum serves as the custodian of the Voluntary National Review process across 193 member states.

1.3 Synergies between SDSN and UN DESA in Global SDG Efforts

The synergy between SDSN and UN DESA is evident in their complementary data collection efforts. SDSN leverages its global network of academics to track the evolving landscape of sustainable development. Meanwhile, UN DESA maintains the official SDG indicator framework that informs monitoring processes.

Since 2016, both organizations have strengthened governance systems through bilateral relationships with national and regional governments. This collaboration is crucial for effective implementation of the sustainable development goals.

OrganizationRoleKey Contributions
Sustainable Development Solutions NetworkMobilizes research expertiseAddresses complex challenges in 193 member states
United Nations Department of Economic and Social AffairsServes as the Secretariat’s economic social armCustodian of Voluntary National Review process
CollaborationData collection and governanceStrengthens systems for sustainable development

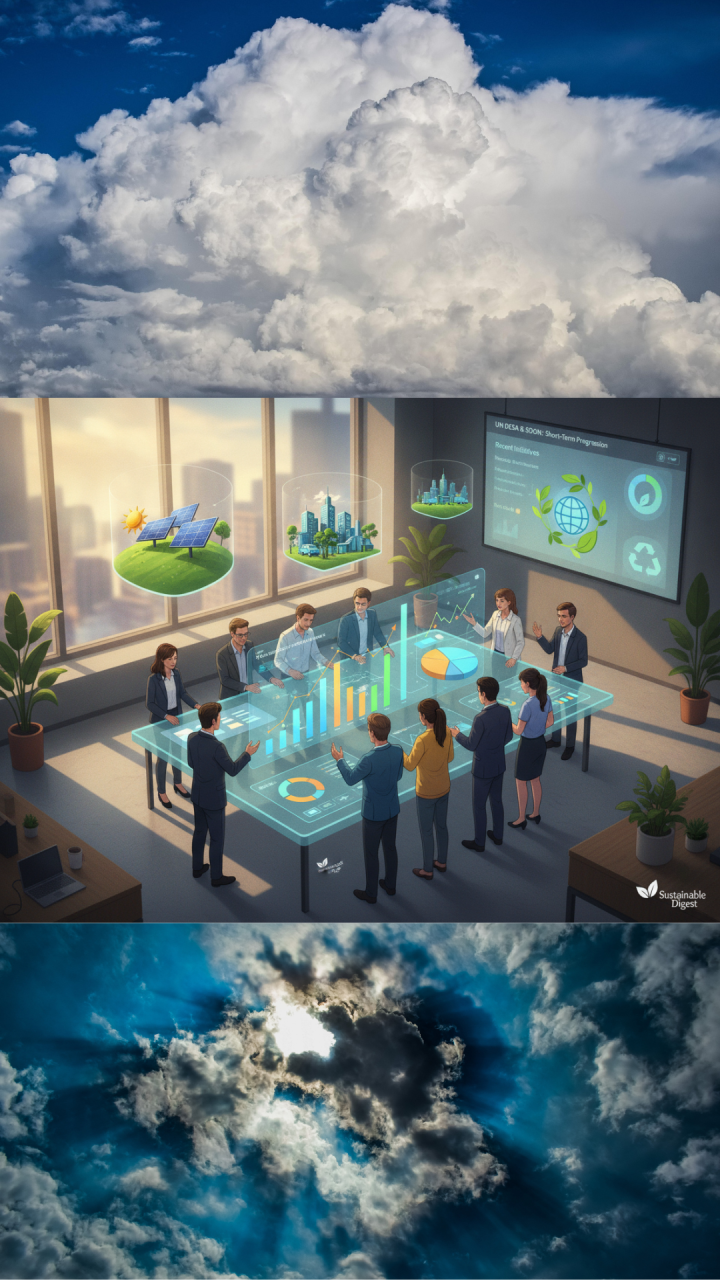
Short-term progressions have seen both institutions grappling with the declining emphasis on sustainable development in high-level discussions. This trend underscores the urgency of their collaborative efforts in fostering a sustainable future.

2. Evolution and Annual Development of the 2026 SDSN Sustainable Development Report

A dramatic visualization of the evolution of the Sustainable Development Report, featuring a timeline that showcases key milestones with symbolic iconsโ€”like renewable energy, education, and community growthโ€”interwoven through a vibrant landscape. In the foreground, diverse professionals in business attire discuss and analyze reports, radiating a sense of collaboration. The middle ground is filled with visuals representing data visualization elements, such as graphs and charts, seamlessly merging with lush greenery and cityscapes, symbolizing progress. In the background, a warm golden sunset casts dramatic lighting, creating an optimistic atmosphere. The overall mood is one of hope and collective advancement toward sustainability. The image embodies the essence of "The Sustainable Digest" and reflects the themes of evolution and development.

The evolution of these reports mirrors the dynamic nature of global development efforts and the pressing need for accountability. Since 2015, the series has transformed from a basic scorecard into a comprehensive tool for assessing progress across nations.

2.1 The Report’s Genesis and Long-Term Development Since 2015

The sustainable development report series began its journey in 2015. It aimed to hold all 193 UN Member States accountable to the newly established SDGs. Over the years, it has evolved into a multidimensional analytical framework, as seen in the latest edition.

2.2 Annual Update Process and Collaborative Mechanisms (2016-2026)

Each annual update since 2016 has introduced methodological refinements. The early editions primarily focused on country rankings. However, later versions incorporated spillover indices and trend analyses. By the latest edition, comprehensive survey data from expert networks and the public have been included.

The collaborative mechanisms behind the annual updates involve a well-coordinated effort. SDSN’s secretariat collaborates with regional offices in Asia, Europe, and North America. An expanding network of local chairs and managers ensures the accuracy of data across all 193 countries.

2.3 Integration of Expert and Public Surveys in Report Refinement

The integration of expert and public surveys marks a significant methodological evolution. The latest edition includes the “2026 Expert Survey on Government Efforts for the SDGs,” covering 64 countries and the European Union. Additionally, it features the “2026 Survey on SDG Challenges and Means for Implementation,” which gathered insights from 1,098 respondents across 127 countries.

Annual decisions have been influenced by the shifting landscape of international development. For instance, the 2019 edition introduced the six SDG Transformations framework, while the 2020 edition addressed the impacts of the COVID-19 pandemic. The latest edition now pivots toward priorities beyond 2030 as the deadline approaches.

Initially affiliated with a university press, the report has matured into a globally recognized authority on SDG progress. Each edition builds on the previous year’s lessons, expanding the universe of data available for cross-country comparisons.

Importantly, all report materialsโ€”including the full PDF, Excel database with scores and ratings, codebook, and methodology documentationโ€”are available for free. This commitment to democratizing data reflects the guiding principles that have shaped the report’s evolution since 2016.

3. Analysis of SDSN Expert and Large-Scale Surveys on SDG Implementation

The recent expert survey sheds light on the effectiveness of government initiatives related to the SDGs. It highlights how these efforts have been integrated into public management practices. This analysis draws on qualitative data collected from experts across various countries, providing a nuanced understanding of SDG implementation challenges.

3.1 The 2026 Expert Survey on Government Efforts

This year’s expert survey represents a methodological triumph in qualitative data collection. It mobilized 65 responses across 64 countries and the European Union. The survey assessed how deeply the SDG framework has penetrated national public management practices since 2018.

Countries like Canada, Denmark, Ghana, and Italy have made significant strides in incorporating the SDG framework into their governmental practices. In contrast, Australia, the United States, and Venezuela have not prioritized the SDGs in their public management frameworks.

3.2 Insights from the 2026 Large-Scale Survey on SDG Challenges

The large-scale survey, encompassing 1,098 respondents from 127 countries, provides a broader perspective on SDG outcomes. An overwhelming 78% of respondents believe that SDG outcomes in their countries have either improved or stagnated from 2015 to 2025.

However, the survey also identified significant barriers to SDG implementation. Notably, 89% of respondents pointed to the failure to implement approved strategies as a critical challenge. Additionally, 87% highlighted the shifting geopolitical landscape as another major hurdle.

3.3 Implications of Survey Findings on Policy and Implementation Practices

The findings from both surveys underscore the unique value of the SDSN in curating insights for the updated report. By triangulating expert assessments, public perceptions, and quantitative indicators, the network provides a multidimensional picture of government efforts.

This comprehensive approach informs the eight priorities for accelerating SDG progress through 2030 and beyond. It reveals that while bureaucratic structures remain in place, the political commitment at the highest levels is waning, as evidenced by the decline in heads of state referencing the SDGs in official speeches.

4. Role and Impact of Voluntary National and Local Reviews in Global SDG Monitoring

A modern conference room bustling with activity, showcasing a diverse group of professionals engaged in a dynamic discussion about Voluntary National and Local Reviews for Sustainable Development Goals (SDGs). In the foreground, a confident woman in business attire gestures toward a digital presentation displaying colorful charts and maps illustrating global progress. In the middle ground, colleagues (all in professional business attire) collaborate, surrounded by documents and laptops, creating a sense of teamwork and innovation. The background features large windows with a city skyline view, bathed in natural light, symbolizing transparency and hope. The mood is energetic and optimistic, reflecting the importance of collective efforts in global monitoring. The overall atmosphere is professional yet inspiring, encapsulated in a clean, contemporary design, embodying the essence of "The Sustainable Digest."

The mechanisms for Voluntary National and Local Reviews have emerged as pivotal tools in tracking global progress. Since 2016, 190 countries have participated in the Voluntary National Review (VNR) process. This achievement represents a remarkable feat of global accountability architecture, particularly in contrast to the three holdouts: Haiti, Myanmar, and the United States.

In 2026, 36 countries are scheduled to present updated reviews of their SDG action plans. Notably, there are no first-time presenters this year. Togo and Uruguay will present their fifth VNRs, showcasing their sustained engagement with this important mechanism. This evolution reflects how the VNR process has transformed from a one-off reporting exercise into an iterative policy learning cycle over the past decade.

The growth of Voluntary Local Reviews (VLRs) tells an equally compelling story. Subnational authorities in 48 countries have produced 386 VLRs from 2016 to 2026. Brazil, Malaysia, Mexico, and Argentina alone account for nearly half of these reviews. The number of VLR submissions surged by 69% from 62 in 2024 to 105 in 2025, indicating a robust local-level momentum for sustainable development.

4.5 Role and Impact of Voluntary National and Local Reviews in Global SDG Monitoring continuing..

UN DESA’s role as the institutional custodian of both VNRs and VLRs has expanded significantly. The Department maintains comprehensive databases tracking participation trends and provides technical support to governments preparing their reviews. This support ensures that these accountability mechanisms feed into the broader SDG implementation monitoring ecosystem.

The absence of the United States from the VNR process, alongside Haiti and Myanmar, highlights a significant gap in global SDG progress monitoring. This is particularly concerning given the country’s influence on international spillover effects, which the SDSN’s spillover index tracks across multiple indicators.

Ultimately, the VNR and VLR mechanisms embody the principle of country-led accountability that underpins the 2030 Agenda. UN DESA’s support infrastructure has evolved from basic reporting templates to sophisticated data platforms, enabling cross-country comparisons and peer learning among the 190 participating countries.

CountryVNR PresentationsVLR Count
Togo515
Uruguay510
Brazil472
Malaysia444
Mexico435
Argentina434
United States00

5. 2026 SDSN Sustainable Development Report Annual Update Review Analysis: Key Findings and Priorities

In this edition, we explore the vital discoveries and strategic priorities emerging from the latest global development evaluations. The 2026 findings reaffirm the Nordic dominance in sustainable development, with Finland, Sweden, and Denmark topping the rankings. However, the sdg index dashboards reveal a more complex narrative.

The spillover index illustrates how the consumption patterns of wealthier nations can negatively impact progress towards achieving the sustainable development goals in the Global South. This nuance is crucial for understanding the interconnectedness of global development efforts.

5.1 Overview of 2026 SDSN Report Rankings and Trends

The rankings from the development report 2026 indicate that while some countries excel, there are underlying issues that need addressing. The interactive maps within the report showcase the performance of nations on each of the 17 goals, providing a clear picture of where efforts are succeeding and where they are lacking.

5.2 Priority Areas and Emerging Issues in the Post-2030 Sustainable Development Agenda

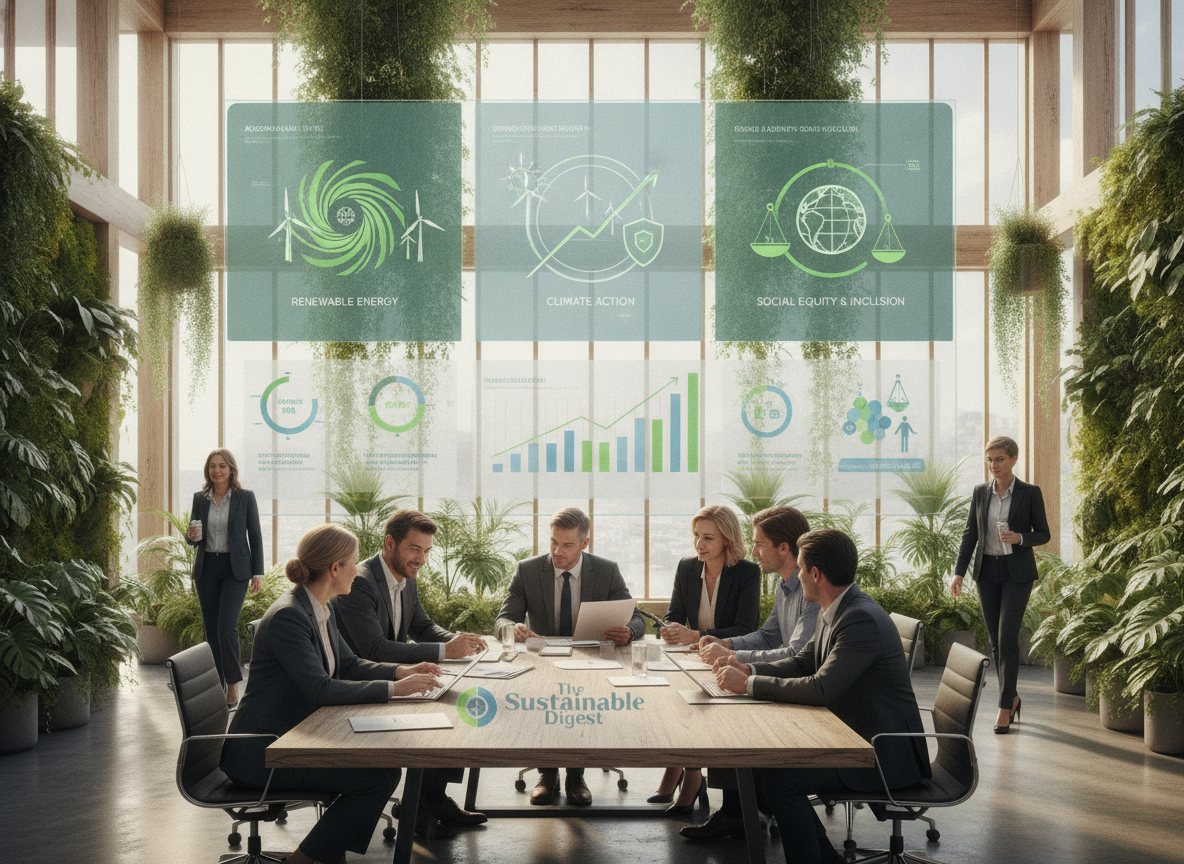
The report identifies eight key priorities for accelerating sdg progress through 2030 and beyond. A remarkable consensus among experts reveals that at least 75% agree on six critical priorities for the post -2030 agenda. These include:

  • Strengthening means for implementation, focusing on governance and data.
  • Developing international guidelines on SDG synergies and trade-offs.
  • Incorporating artificial intelligence into future frameworks.
  • Reforming the global financial architecture to address budgeting gaps.
  • Ensuring stability in the framework while maintaining continuity in goals.
  • Better reflecting and incorporating international spillovers.

5.3 SDSN and UN DESA’s Collaborative Role in Shaping International Development Policies

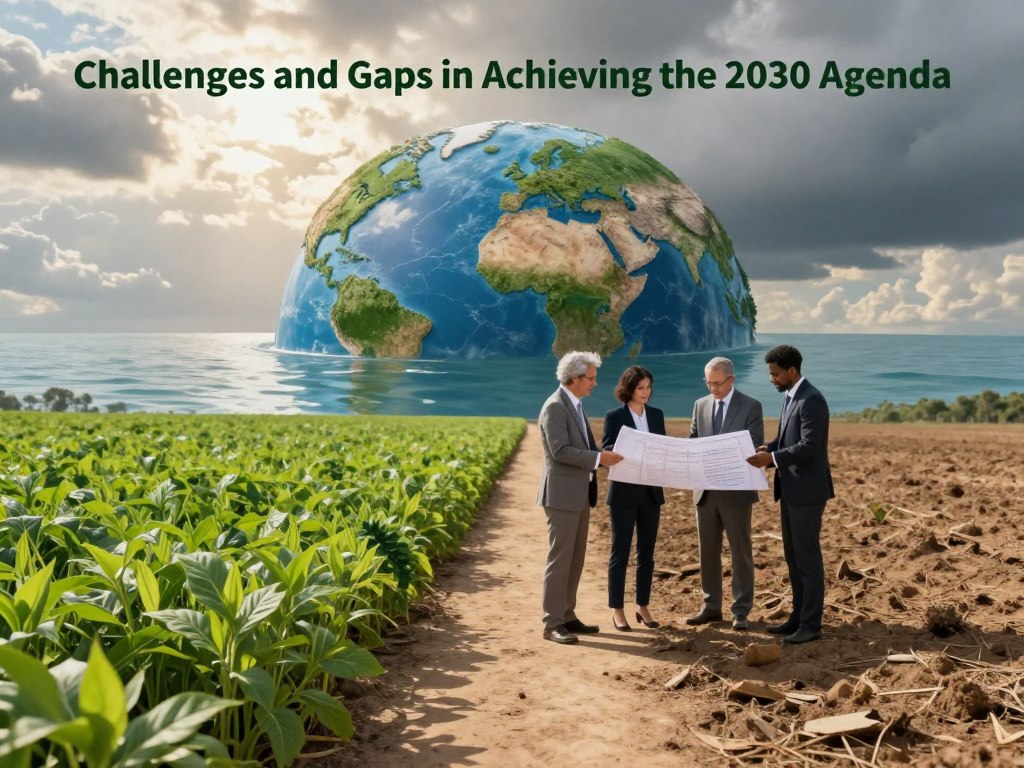
The collaborative dynamic between SDSN and UN DESA plays a pivotal role in shaping international development policies. Their joint efforts highlight the importance of aligning government strategies with budget allocations. The findings indicate a persistent gap between adopting strategies and allocating necessary resources, which must be addressed in future negotiations.

Dr. Guillaume Lafortune’s recent publication emphasizes the need for a credible framework to guide the post -2030 agenda. This intellectual groundwork will help bridge the gap between academic rigor and practical policy applications, ensuring that future efforts are both informed and effective.

As we look toward 2030 and beyond, the sdg index dashboards serve not just as a report card but as a strategic compass. They provide actionable insights on where government efforts have succeeded and where they have stalled, guiding priorities for the future.

6. Conclusion

The synthesis of findings highlights the intricate tapestry of global initiatives at play. This edition showcases how the collaborative efforts of key organizations have matured over time. The convergence of expertise from various countries and institutions illustrates a commitment to advancing meaningful progress.

Moreover, the eight identified priorities serve as a roadmap for future actions. They not only address past shortcomings but also pave the way for innovative solutions. The free availability of data further exemplifies a dedication to transparency and accessibility.

As we navigate the path toward a more equitable future, the development process between these organizations stands as a model. It demonstrates how ongoing collaboration can yield actionable insights, ensuring that the global dialogue on sustainable development remains vibrant and impactful.

Key Takeaways

  • This report synthesizes ten years of data since the 2015 adoption of the 2030 Agenda.
  • It identifies eight priorities to enhance progress toward global goals.
  • Insights from expert and public surveys inform actionable strategies.
  • Top-ranking countries showcase effective long-term commitments.
  • Interactive tools allow for exploration of historical data trends.

Global Carbon: pricing, taxes, crediting, projects, footprint, REC, ESC, storage Explained

Global Carbon: pricing, taxes, crediting, projects, footprint, REC, ESC, storage

This Ultimate Guide frames how price signals, compliance schemes, voluntary credits, and renewables fit for U.S. decision-makers and international planners.

The landscape hit a record in 2022: revenues neared USD 100 billion and EU allowances reached โ‚ฌ100. Yet most emissions still trade at modest levels; fewer than 5% face prices near the $50โ€“$100/tCO2 range suggested for 2030.

Readers will get clear, practical steps on procurement choicesโ€”unbundled renewables, PPAs, and green tariffsโ€”and guidance on integrity standards such as Core Carbon Principles and CORSIA. The piece contrasts direct instruments (tax and ETS) with hybrid standards and voluntary instruments that complement compliance systems.

Expect concise analysis of supply trends: renewables drove most credit issuance, nature-based registrations rose, and removals technology is growing under stricter quality screens. U.S.-specific notes touch on RGGI, SREC differences by state, and the federal solar ITC through 2032.

Carbon pricing at present: where markets, taxes, and credits stand now

Todayโ€™s price signals mix steady market gains with glaring coverage gaps that shape near-term decisions.

What a โ€œprice on carbonโ€ means today for climate and energy decisions

A price on carbon is a monetary signal embedded in consumption and production choices; it nudges investment toward low-emitting assets and away from legacy polluters.

The tool works by raising the cost of emissions and making abatement economically visible. In 2022 revenues approached nearly USD 100 billion, while the EU ETS breached a symbolic โ‚ฌ100 level โ€” proof that robust signals can persist despite shocks.

Coverage versus price: why both matter for impact

Impact requires two levers: sufficient price levels to change marginal decisions, and broad coverage so a large share of emissions respond.

  • About 23% of global emissions were under ETS or levy systems by April 2023.
  • Fewer than 5% of ghg emissions faced direct prices in the $50โ€“$100/tCO2 band, so many sectors remain exposed.

Markets and credits (compliance vs voluntary) both influence cost curves; only direct pricing enforces statutory abatement. Corporates should set internal price signals, align procurement, and rely on quality offsets to bridge near-term gaps. Solid data tracking is essential to forecast exposure and hedge procurement risks.

The pillars of pricing: carbon taxes, ETS, and hybrid systems

An intricately detailed, photorealistic image depicting the pillars of carbon pricing - a complex system of carbon taxes, emissions trading schemes (ETS), and hybrid systems. Showcase the inner workings of an ETS, with close-up views of emission allowances, trading platforms, and the intricate web of regulations. Capture the macro-level interactions between governments, industries, and the carbon market, set against a backdrop of modern cityscapes and industrial landscapes. Convey a sense of urgency and the high stakes involved, with muted tones and dramatic lighting. Prominently feature the brand "The Sustainable Digest" in the lower right corner.

The policy toolkit breaks into three practical choices: a perโ€‘unit levy, a capped allowance market, and hybrids that mix benchmarks with trading. Each design shapes incentives and risk differently for firms and regulators.

Carbon tax fundamentals and current ranges in practice

A tax sets a transparent perโ€‘ton price on emissions (or fuel). It is easy to administer and makes revenue predictable; governments can return funds as dividends or cut other levies.

Examples include Singaporeโ€™s planned rise to about USD 38โ€“60 from 2026 and Canadaโ€™s pathway toward roughly USD 127 by 2030. Higherโ€‘income jurisdictions often reach prices above $50 per tonne; middleโ€‘income ones pilot lower levels while building measurement systems.

Emissions Trading Systems: caps, allowances, and trading

ETS create a cap on total emissions; regulators issue allowances (EUAs, UKAs, NZUs, KAU) that firms buy, sell, or bank. The cap delivers quantity certainty while markets reveal marginal abatement costs.

Hybrid models: OBPS, EPS, and regional cap-and-trade like RGGI

Hybrids try to shield tradeโ€‘exposed sectors. Outputโ€‘based performance standards (OBPS) and emissions performance standards (EPS) set benchmarks instead of pure perโ€‘unit charges.

  • RGGI auctions allowances and directs proceeds to regional programs.
  • Hybrids reduce leakage but add design complexity and reliance on strong MRV for compliance.

Global price signals and coverage by region, based on World Bank 2023

Regional price bands reveal as much about institutional capacity as they do about political will. As of April 2023, 73 instruments covered roughly 23% of emissions worldwide. Yet less than 5% of ghg emissions faced a highโ€‘level signal in the $50โ€“$100/tCO2 range.

High-income versus middle-income bands

Highโ€‘income jurisdictions often cluster above $50 per ton; the european unionโ€™s ETS even hit โ‚ฌ100, reinforcing strong market responses and revenue recycling.

Middleโ€‘income systems mostly price under $10. Exceptionsโ€”Beijing and Guangdong pilots, Mexicoโ€™s subnational measures, and Latviaโ€™s taxโ€”show how pilots build MRV and administrative muscle.

Why coverage matters as much as price

A high signal on a sliver of emissions is not the same as modest signals applied broadly. A $75/t signal on 5% of emissions underperforms a $25/t signal covering half the economy when the goal is nearโ€‘term structural change.

  • Constraints: fossil fuel subsidies and energy volatility can blunt signals.
  • Capacity: MRV and admin readiness are gating factors for expansion.
  • Implication: closing the

Revenues from carbon pricing: record highs and how funds are used

Governments saw nearly USD 100 billion arrive from emissions-related instruments in 2022, shifting the budget conversation.

Most of that cash came from traded allowances rather than direct levies. About 69% of receipts were generated by ETS mechanisms, while roughly 31% came from tax-based schemes. The EUโ€™s system alone produced about $42 billion in 2022 โ€” nearly seven times its 2017 level โ€” as auctioning replaced free allocation.

How countries recycle proceeds

Use of funds varies but trends are clear: roughly 46% of revenue is earmarked for targeted programs, 29% flows to general budgets, 10% serves as direct transfers (social cushioning), and 9% offsets other taxes.

Revenue SourceShare (2022)Main Uses
ETS (auctioning)69%Clean energy, innovation, adaptation
Tax-based levies31%Budget support, rebates, targeted transfers
EU auctioning$42BMarket tightening, transition aid, R&D

Policy implications

Predictable recycling improves public support and compliance. In the U.S., RGGI shows how reinvestment in efficiency and community programs builds durability.

Yet revenues remain priceโ€‘sensitive: allowance downturns or tax adjustments can cut fiscal inflows and weaken program credibility. Sound data tracking and transparent use of proceeds help stabilize expectations for investors and households alike.

Compliance markets around the world: EU ETS, China ETS, UK, K-ETS, NZ, Australia

A panoramic landscape showcasing the intricate workings of global carbon markets. In the foreground, a detailed illustration of the EU Emissions Trading System (EU ETS), with its trading platforms, registries, and compliance mechanisms. In the middle ground, smaller vignettes depict the China ETS, UK ETS, K-ETS, NZ ETS, and Australia's carbon pricing schemes. The background features a montage of renewable energy projects, carbon storage facilities, and sustainable technologies. The scene is bathed in warm, golden light, conveying the sense of progress and innovation in the world of climate finance. The brand "The Sustainable Digest" is subtly integrated into the artwork. Photorealistic rendering with a blend of macro and micro perspectives.

Compliance markets now form the backbone of many national climate strategies; each system creates unique signals for firms and regulators.

EU ETS and UK ETS: alignment, divergence, and EUA pricing dynamics

The european unionโ€™s ETS remains the largest by value and a global price benchmark. Its auction cadence and market design drive allowance liquidity and long-term expectations.

The UK launched an independent ETS in 2021. Designs share DNA, but governance differences have produced divergent EUA and UKA prices paths and trading patterns.

Chinaโ€™s power-sector ETS and expected sectoral expansion

Chinaโ€™s system started in 2021 and covers roughly 40% of national emissions through the power sector. Authorities plan phased expansion to steel, cement, and other heavy industries.

That expansion will reshape regional supply-demand dynamics and create larger cross-border hedging needs for firms exposed to Asian markets.

K-ETS, NZ ETS, and Australiaโ€™s ACCUs: coverage and policy evolution

South Koreaโ€™s K-ETS (2015) now covers about 75% of S1+S2 emissions and is in a liquidity-building phase.

New Zealandโ€™s scheme covers more than half the national total; agricultural treatment remains an open policy frontier under review.

Australia relies on ACCUs as domestic offset-like units, with a cost-containment cap rising to AUD $75/tonne (CPI+2). These rules influence corporate hedging, procurement timing, and exposure across both allowances and offsets.

Voluntary carbon market and standardized contracts

A new set of futuresโ€”segmented by supply type and verificationโ€”lets buyers hedge quality risk ahead of delivery.

N-GEO: nature-based baskets

N-GEO packs verified AFOLU credits (Verra) into a tradable instrument. It aggregates forest and landโ€‘use supply to smooth price swings and capture coโ€‘benefits; buyers get bundled nature exposure with predictable forward quantities.

GEO: CORSIA-aligned aviation units

GEO mirrors ICAO CORSIA rules and draws from Verra, ACR, and CAR. That alignment tightens eligibility and raises baselines for aviation-grade integrity; it helps airlines meet offsets for international emissions while improving market trust.

C-GEO and Core Carbon Principles

C-GEO focuses on tech-based, non-AFOLU units that meet the Integrity Councilโ€™s CCPs. The CCPs set a quality floorโ€”MRV rigor, permanence, governanceโ€”and narrow seller pools; the result is clearer pricing for high-integrity credits.

ContractSupply TypeKey Benefit
N-GEONature-based (Verra)Co-benefits; cheaper forward supply
GEOCORSIA-eligible (Verra/ACR/CAR)Aviation-grade acceptance; tighter eligibility
C-GEOTech removals (CCP-aligned)Higher integrity; lower permanence risk

Practical advice: blend N-GEO, GEO, and C-GEO to balance cost, quality, and forward certainty; use futures for trading and hedging. Note that some compliance regimes may recognize limited voluntary units under strict rules.

Projects and supply: renewable energy, nature-based solutions, and REDD+

A panoramic landscape showcasing an array of renewable energy projects, bathed in warm, golden hour lighting. In the foreground, a sprawling solar farm with sleek, reflective panels capturing the sun's rays. In the middle ground, towering wind turbines gracefully spinning, their blades cutting through the crisp air. In the distance, a gleaming hydroelectric dam nestled between lush, rolling hills. The scene is punctuated by pops of green foliage, hinting at the integration of nature-based solutions. The entire composition is captured with a cinematic, wide-angle lens, conveying a sense of scale and ambition. The Sustainable Digest brand name is subtly woven into the natural environment.

Patterns of supply now show dominant renewable energy output alongside a surging nature-based pipeline.

Renewable energy projects accounted for roughly 55% of issued units in 2022 and about 52% of retirements; wind and solar led issuance while falling technology costs reduced additionality concerns for large installations.

That decline in cost suggests issuance from new renewable energy schemes may taper as grid parity widens; buyers should expect shifting supply mixes over multi-year horizons.

Nature-based supply and REDD+

Nature-based solutions made up about 54% of new registrations in 2022, driven by biodiversity and livelihoods co-benefits; avoided deforestation (REDD+) and improved forest management remain core AFOLU sources.

  • REDD+ design focuses on avoided loss, leakage controls, and permanence buffers to manage long-term risk.
  • Latin Americaโ€”Brazil, Colombia, Chileโ€”updated forestry rules in 2023, expanding pipelines and governance.

Risks persist: baseline integrity, permanence, and social safeguards determine investability and unit performance over time.

Buyer advice: match geography and methodology to claimed outcomes (avoided emissions vs removals); prefer blended portfolios and multi-year contracts to hedge supply and quality risk.

Renewable Energy Credits (RECs) and SRECs: how they work and how to buy

Renewable energy certificates certify one megawatt-hour of clean generation; they capture the attribute of green power, not the physical electron. Think of a serial-numbered proof of production.

The issuance process includes a unique registry serial, a generation timestamp, and a formal retirement step to prevent double counting. These tracked credits let buyers claim renewable energy use while grids mix electrons.

Procurement pathways

  • Unbundled certificates deliver speed and flexibility; they are lowest-friction for offsetting consumption.
  • PPAs provide additionality and long-term price certainty for a larger renewable energy project.
  • Utility green tariffs and green pricing are simple on-ramps for organizations that prefer a managed offering.
  • On-site self-generation produces SRECs or surplus certificates that can offset local loads or be sold into the market.

Prices and policy basics

SRECsโ€”solar-specific certificatesโ€”vary widely by state, often ranging from about $10 to $400; some wind certificates trade as low as $1โ€“$8. The U.S. federal solar investment tax credit (ITC) is 30% for systems installed through 2032, which affects payback and overall cost.

Practical buyer advice

Match vintage and geography to program rules and distribute purchases across sites for proportional coverage. For compliance users, ensure certificate attributes meet local requirements and that retirement is verifiable to avoid claims that conflict with emissions accounting.

RECs vs carbon credits: different instruments, different impacts

Detailed photorealistic image of a diverse range of renewable energy sources, including wind turbines, solar panels, hydroelectric dams, geothermal plants, and biofuel production facilities. The scene showcases the interconnected nature of these technologies, with clean energy infrastructure seamlessly integrated into natural landscapes. Vibrant colors, sharp focus, and dramatic lighting create a sense of power and progress. In the foreground, a central display prominently features the logo "The Sustainable Digest", highlighting the publication's focus on renewable energy and sustainability. The overall composition conveys the message of a sustainable future powered by clean, renewable sources.

RECs and carbon credits play distinct roles in corporate climate strategy. One documents renewable electricity attributes in kWh; the other represents a tonne of avoided or removed CO2e.

Offsetting electricity (kWh) versus GHG mitigation (tCO2e)

Market-based Scope 2 accounting recognizes renewable energy certificates for electricity use. That helps firms claim green energy consumption without changing grid flows.

By contrast, a carbon credit quantifies a reduction or removal of carbon emissions. Those units address Scope 1 or Scope 3 exposures where allowed.

  • Clarity: RECs = attribute per kWh; carbon credits = tonne-level mitigation.
  • Accounting: use market-based certificates for electricity; apply high-quality offsets for residual emissions.
  • Integrity: disclose boundaries, vintage, and methodology to avoid double claims.

Combine efficiency, on-site renewable energy, and then select verified credits for remaining emissions. Over-reliance on unbundled certificates can look cosmetic and risk reputation. A balanced portfolio gives both energy claims and real emissions results.

ESC and performance-based approaches: EPS, OBPS, and sector benchmarks

Where full economy-wide charges stall, performance approaches offer a pragmatic path for hard-to-abate industries. Canadaโ€™s OBPS taxes emissions above output-based benchmarks; the UK operates an EPS model; several U.S. states use similar standards.

How they work: intensity targets tie allowable pollution to production output. Facilities that beat the benchmark can earn tradable compliance units; those that lag must pay or purchase units to meet obligations.

Policy position: hybrids fill gaps where full caps or levies face political or administrative hurdles; they also reduce leakage risk for trade-exposed firms. Benchmarks often sit alongside an ets or free allocation, shaping who gets credits and who pays.

  • Design note: benchmarks reward intensity improvements rather than absolute cuts.
  • Market interaction: over-performance creates supply of compliance units that trade in secondary markets.
  • Industry advice: audit baselines, plan capital upgrades, and register performance early to monetize gains where allowed.

For companies, the practical step is simple: measure ghg and output carefully, test upgrades against benchmarks, and treat these systems as another compliance channel in carbon risk planning.

Carbon storage and removals in markets: from nature to tech

A breathtaking landscape showcasing the future of carbon storage and removal technologies. In the foreground, a towering carbon capture facility stands proud, its sleek design and efficient operation a testament to human ingenuity. The midground reveals lush, verdant forests, nature's own carbon sinks, with intricate leaf structures and vibrant hues. In the distance, rugged mountains rise, their rocky peaks capped with pristine snow, a symbol of the delicate balance between technology and the natural world. Lighting is soft and directional, casting gentle shadows and highlighting the textures of the scene. The overall mood is one of hopeful optimism, a vision of a sustainable future where "The Sustainable Digest" chronicles the progress of carbon management.

Not all removals are created equal; the market is learning to pay a premium for permanence. Nature-based options (afforestation, reforestation, improved forest management) supply broad volumes, while engineered solutions (DACCS, mineralization) deliver durability at higher cost.

Nature-based versus tech-based crediting

Removals remove CO2 from the atmosphere; avoided emissions prevent further releases. Markets now price that differenceโ€”true removals command higher rates because they reduce legacy concentration.

Permanence and risk differ sharply. Tech-based removals tend to offer stronger durability; nature-based supply needs buffers, monitoring, and active stewardship to manage reversal risk.

  • Cost profile: tech = premium; nature = larger supply but integrity scrutiny.
  • Procurement tip: match a carbon offset type to your claimโ€”removal vs reductionโ€”and budget limits.
  • Standards matter: CCPs and CORSIA-style rules push clearer disclosure and better MRV.

Buyers should blend units: use nature for volume and tech removals to meet permanence needs and reputation goals.

Measuring your carbon footprint and using credits/RECs credibly

A modern, well-lit office space, with large windows letting in natural light. In the foreground, a desk with a laptop, calculator, and various carbon measurement tools - emissions calculators, energy usage monitors, and carbon accounting software. The mid-ground features a team collaborating, discussing data and analyzing charts on the screen. In the background, a wall-mounted display shows a detailed carbon footprint analysis, with different sectors and emissions sources highlighted. The overall mood is focused, professional, and data-driven. "The Sustainable Digest" logo is subtly incorporated into the scene.

Accurate measurement and clear rules turn good intentions into credible climate claims. Start by defining boundaries for Scope 1, Scope 2 (location vs market-based), and Scope 3 so inventories reflect actual operational exposure.

Scopes, market-based accounting, and avoiding double counting

Market-based Scope 2 accounting recognizes renewable certificates; standardized registries use serial numbers and retirements to prevent duplicate claims. Voluntary retirement reached roughly 196 million units in 2022, showing market maturation.

Document contracts, attestations, and registry retirements clearly; auditors expect traceable records. This practice reduces reputational risk and improves compliance readiness.

Integrating efficiency, renewables, and high-quality offsets

Follow a hierarchy: improve efficiency first, then buy renewables through PPAs or on-site systems (the U.S. solar ITC offers a 30% incentive through 2032), and use high-quality credits only for truly residual emissions.

Practical tip: set an internal carbon price to steer capital and align procurement with expected external signals. Transparent reporting, registry exclusivity, and strong data governance keep claims defensible.

Global Carbon: pricing, taxes, crediting, projects, footprint, REC, ESC, storage

A striking photograph showcasing the diverse forms and textures of carbon in its natural and industrial states. The image features a central close-up of a graphite pencil tip, revealing the intricate, layered structure of this allotrope. Surrounding it, a series of macro and micro shots depict the raw mineral form of graphite, the amorphous structure of activated charcoal, and the geometric patterns of carbon nanotubes. Woven throughout, subtle hints of "The Sustainable Digest" branding create a cohesive, visually compelling narrative about the global carbon cycle. Dramatic lighting and a muted color palette evoke the seriousness and importance of the subject matter.

This section ties price signals, coverage regimes, and procurement tools into a compact playbook for decision-makers. It links major program examplesโ€”EU ETS at the โ‚ฌ100 milestone, the UK ETS after Brexit, Chinaโ€™s power-sector ETS (~40% coverage), K-ETS (~75% of S1+S2), New Zealandโ€™s economy-wide scheme, and Australiaโ€™s ACCUs cap (AUD 75, CPI+2)โ€”to practical buying choices.

Key connections to remember:

  • Compliance and voluntary domains interact; standards like CORSIA and CCPs raise the quality floor for credits.
  • Procurement playbook: unbundled certificates, SRECs/on-site solar, long-term PPAs, green tariffs, and verified offsets or removals.
  • VCM instruments (N-GEO, GEO, C-GEO) provide nature, aviation, and tech pathways for forward coverage.

Practical note: U.S. buyers should watch EU, UK, and China price signals as strategic indicators. A blended approachโ€”using renewables for immediate claims and high-integrity credits for residual co2โ€”keeps plans defensible and aligned with evolving market dynamics.

What U.S. buyers should know now: RGGI pathways, PPAs, and procurement strategy

Expansive aerial view of a diverse renewable energy landscape, featuring gleaming wind turbines, sprawling solar farms, and hydroelectric dams nestled in lush, verdant surroundings. Intricate close-ups showcase the inner workings of these cutting-edge technologies, from the intricate solar panel arrays to the towering wind turbine blades. A sense of clean, efficient power emanates throughout, complemented by a vibrant, optimistic atmosphere. The overall scene conveys a vision of a sustainable future, one where "The Sustainable Digest" celebrates humanity's progress towards a greener, more environmentally conscious world.

For U.S. procurement teams, the key decision is balancing speed, certainty, and reputation when buying renewable energy and complementary credits. This choice affects exposure to allowance costs, wholesale prices, and compliance risk.

Choosing between unbundled certificates, on-site solar, and long-term PPAs

Unbundled certificates are fast and flexible; they suit near-term claims and short windows (21 months for some programs). On-site solar gives operational value and pairs with the 30% federal solar tax credit through 2032.

Long-term PPAs (10โ€“20 years) add additionality and hedge against volatile wholesale prices; they also help finance large energy projects.

OptionSpeedAdditionality / HedgeTypical Tenor
Unbundled certificatesFastLow additionalityShort (0โ€“3 yrs)
On-site solarMediumOperational value; ITC benefitAsset life (20+ yrs)
Long-term PPASlowHigh; price hedge10โ€“20 yrs

Applying CORSIA-grade and nature-based credits in U.S. portfolios

Use GEO (CORSIA-grade) and N-GEO/C-GEO blends to cover residual emissions. Carbon credits that meet CCP standards improve quality signals and reduce reputational risk.

Note RGGI auctions can push allowance costs into retail rates; buyers should model that exposure and consider incentive programs, SREC variability by state, and PPA tenor when planning trade-offs.

Outlook to 2030: scaling prices, coverage, and integrity

An expansive vista of a bustling financial district, towering skyscrapers reaching toward the sky. In the foreground, a close-up of a digital display, showcasing fluctuating carbon prices against a backdrop of cascading numbers and charts. The scene is bathed in warm, golden light, creating a sense of urgency and anticipation. Subtle reflections dance across the sleek, glass facades, hinting at the complex interplay of global markets. The Sustainable Digest logo is discretely embedded within the scene, a testament to the publication's expertise in this domain. A striking balance of micro and macro perspectives, conveying the scale and significance of carbon pricing in the evolving landscape of sustainability.

Expect stronger financial nudges over the next decade as regulators tighten limits and extend coverage into new sectors.

World Bank scenarios point to a $50โ€“$100/tCO2 band by 2030 to align with temperature goals. Today, fewer than 5% of global emissions face that signal; roughly 73 instruments cover about 23% of emissions.

That gap means policy design will determine whether prices actually climb or merely ping regional markets. Key levers include tighter caps, reduced free allocation, escalator fees, and sector expansion into heavy industry and transport.

Implications for markets and supply

Expect three shifts: wider systems coverage, higher perโ€‘ton values, and stronger integrity rules. The EU ETS milestones show how rapid tightening can lift market signals.

  • Coverage: more jurisdictions will add or link trading systems and hybrid benchmarks.
  • Integrity: CCPs and CORSIA-style norms will raise baselines, permanence, and transparency.
  • Supply: AFOLU pipelines will mature while tech removals win a price premium for durability.

For U.S. buyers the practical steps are clear: set an internal price, lock long-term PPAs where possible, and pre-position for higher-quality offset supply to manage exposure and reputational risk.

Conclusion

Total conclusion of carbon and climate context

Policy signals, rising receipts, and stronger standards have nudged the market toward maturity; 2022 revenues neared USD 100 billion while voluntary retirements reached roughly 196 million units.

Coverage remains uneven: about 73 instruments now touch ~23% of global emissions, and fewer than 5% of emissions face the $50โ€“$100 perโ€‘ton band. Nature-based registrations supplied roughly 54% of new supply in recent years.

The practical playbook is unchanged: cut energy use first; deploy renewables and long-term contracts; then buy high-quality credits for residual emissions. Internal pricing, clear governance, and transparent claims will matter as signals tighten.

Integrity and scale must advance together; only that tandem will deliver durable change across the world in the coming years.

Key Takeaways

  • 2022 revenues reached record levels while price exposure remains uneven across regions.
  • Direct pricing (tax/ETS), performance standards, and voluntary credits play different roles.
  • Renewable credits dominate supply; nature-based and tech removals are expanding.
  • U.S. options include RGGI pathways, SREC variability, and the 30% solar ITC.
  • Only a small share of emissions face near-$50โ€“$100 prices today; scale and integrity are urgent for 2030.

This website is saving the energy of your screen as it is not being used. It's part of a global effort to lower the planet's electrical consumption and CO2 emission level. Resume browsing
Click anywhere to resume browsing
Verified by MonsterInsights