Today, companies face a big challenge in showing they care about the planet. It’s like trying to solve a puzzle with many pieces that keep changing. They need to show they’re good for the environment, but it’s hard because of all the confusing terms and rules.
Knowing how to cut down on carbon emissions is now a must for big players worldwide. They have to understand the different ways emissions are measured. This is important for being open and sustainable in the long run.
Many companies get confused between being Carbon Neutral and Net Zero. Both goals are about reducing harm to the environment. But they mean different things for a company’s future. It’s key for leaders to know the difference to succeed in a green economy.
Understanding the Hierarchy of Emissions: Scope 1, 2, and 3
To understand environmental accountability, we need to know about carbon emissions. The Greenhouse Gas Protocol sets a global standard for measuring climate impact. It breaks down emissions into three main areas, helping companies make real progress.
Defining Direct and Indirect Emissions
Scope 1 emissions come from sources the company owns or controls. This includes fuel used in boilers and company vehicles. If the smoke comes from your own chimney, it’s a direct emission.
Scope 2 emissions are indirect. They come from the electricity, steam, and cooling the company buys. Even though the company doesn’t burn the fuel, it’s responsible for the energy demand.
“Sustainability is no longer just a moral imperative; it is a fundamental metric of operational efficiency and long-term business viability.”
The Progression from Operational to Value Chain Impact
Scope 3 emissions are the most complex and largest part of a company’s footprint. They include indirect emissions in the value chain, from raw material extraction to product disposal. This category is vast, covering all activities in the supply chain.
Switching to value chain management requires a new way of thinking. Companies must influence suppliers and logistics partners. This shift is crucial for anyone wanting to fully understand their environmental impact.
Category
Primary Source
Control Level
Scope 1
Direct fuel combustion
High
Scope 2
Purchased energy
Medium
Scope 3
Value chain activities
Low to Moderate
Managing these areas well helps companies find hidden risks and new opportunities. By tackling all emissions, companies show they’re serious about global climate goals.
Defining the Sustainability Milestones: Carbon Neutral, Net Zero, and Net Positive
The path to caring for our planet is marked by three key milestones. These terms, though often mixed up, show different levels of commitment. Knowing these steps is key for any company wanting to be eco-friendly.
The Evolution of Corporate Climate Ambition
Companies’ efforts to fight climate change have grown from a simple marketing tactic to a serious plan. At first, many focused on being Carbon Neutral. This meant buying credits to offset their emissions. But it didn’t fix the real problems in their business.
As people started to notice more, companies aimed for Net Zero. This goal means cutting emissions as much as possible, with just a bit left to offset. Now, the best companies aim for Net Positive. They want to make the planet better, not just not harm it.
Distinguishing Between Offsetting and Absolute Reduction
There’s a big difference between using carbon credits and really cutting emissions. Relying on offsets lets companies feel good without changing. True sustainability means changing how a company works, like using green energy or making products that can be recycled.
Changing how a company works is called absolute reduction. It’s about making real changes, not just paying for them. The table below shows how these three goals differ.
Milestone
Primary Focus
Reduction Strategy
Outcome
Carbon Neutral
Balancing emissions
High reliance on offsets
Neutral impact
Net Zero
Deep decarbonization
Science-based targets
Minimal residual impact
Net Positive
Regenerative impact
Restorative business models
Positive ecological gain
Analyzing the Relationship Between Scope 1 and Carbon Neutrality
Direct emissions are the biggest challenge for companies wanting to be Carbon Neutral. Many focus on the whole value chain, but Scope 1 emissions are key. Ignoring these while using offsets is like cleaning up while the mess keeps happening.
Direct Emissions and the Carbon Neutral Framework
To achieve neutrality, companies must track all fuel use, company cars, and leaks. These direct sources are under their control. Without accurate data, any claim of neutrality is shaky.
Companies use offsets to balance their carbon output. But, relying only on offsets without cutting Scope 1 emissions is not seen as genuine. True Carbon Neutral status means cutting emissions first, then using offsets.
Similarities and Contrasts in Operational Accountability
Being accountable means showing real change, not just numbers. Scope 1 deals with the physical act of burning fuels. The Carbon Neutral goal is the bigger picture that makes these efforts valid. Here’s how they differ in corporate strategy.
Feature
Scope 1 Management
Carbon Neutral Goal
Primary Focus
Direct fuel combustion
Net balance of emissions
Control Level
High (Internal assets)
Variable (Includes offsets)
Strategic Role
Operational baseline
Public-facing milestone
Success Metric
Absolute reduction
Net zero balance
Using Scope 1 and Carbon Neutral best practices means moving from just reporting to real management. Companies should see direct emissions as something to constantly improve. By linking these two, businesses can go beyond just following rules and become more resilient.
Connecting Scope 2 Emissions to Net Zero Targets
Direct emissions are easy to see, but Scope 2 energy use is harder to track. Many think just being energy-efficient is enough for Net Zero. But, it’s more complicated, needing a detailed look at every energy source.
Energy Procurement and the Net Zero Mandate
Going from saving energy to cutting all carbon is key for a strong sustainability plan. Companies must check their energy procurement as carefully as their finances. To follow Scope 2 and Net Zero best practices, they should switch to renewable energy and long-term power deals.
Just buying green energy certificates isn’t enough anymore. Companies must show they’re adding to the clean energy mix. This makes energy a powerful tool for fighting climate change.
Bridging the Gap Between Indirect Energy Use and Global Goals
To meet global goals, businesses need to change how they buy energy. By matching their energy buys with the grid’s clean-up plans, they can cut their emissions. This is key for reaching Net Zero without just using carbon offsets.
The table below shows how to move from old energy use to clean energy:
Strategy Level
Energy Source
Impact on Net Zero
Complexity
Basic Efficiency
Standard Grid Mix
Minimal
Low
RECs Purchase
Renewable Credits
Moderate
Medium
Direct PPA
Dedicated Renewables
High
High
Grid Transformation
Systemic Renewables
Very High
Very High
The future is about making smart choices with electricity. Companies that understand their indirect energy use will lead in a changing world.
Addressing Scope 3 Challenges and the Path to Net Positive
Most companies struggle with Scope 3 emissions. Yet, this is where they can make the biggest change. While they can control their own emissions, the value chain is complex and hard to manage.
The Complexity of Value Chain Emissions
Tracking value chain emissions is tough because they happen outside the company. They include raw materials and energy used by customers. Transparency often suffers in this system.
Companies need to work closely with partners to get accurate data. Without it, they can’t report on their sustainability efforts. Using averages is no longer enough for stakeholders who want detailed information.
Moving Beyond Neutrality Toward Net Positive Impact
Going from carbon neutrality to Net Positive is a big change. Neutrality aims to minimize harm, while Net Positive seeks to help the environment more than it takes. This shift requires a new way of thinking about business.
Companies must do more than just offset carbon. They need to restore ecosystems and support regenerative practices. The table below shows the key differences between these approaches.
Strategy Focus
Scope 3 Management
Net Positive Ambition
Primary Goal
Reduction of indirect impact
Active environmental restoration
Operational Scope
Value chain transparency
Regenerative business models
Best Practices
Scope 3 and Net Positive best practices
Holistic ecosystem investment
Success Metric
Lowered carbon intensity
Measurable net gain
By following Scope 3 and Net Positive best practices, companies can overcome old accounting limits. Seeing the value chain as a chance to restore the environment is key. This is not just a trend; it’s the new standard for leadership.
The Theoretical Evolution: Exploring the Concept of Scope 4
Scope 4 goes beyond the usual Scope 1, 2, and 3. It changes how we see corporate climate responsibility. Instead of just looking at past damage, Scope 4 looks at the chance for positive climate intervention. It’s a shift from just accounting for damage to actively caring for the environment.
Defining Avoided Emissions
Avoided emissions, or Scope 4, are about reducing greenhouse gases outside a company’s direct chain. It’s about the theoretical gains when a customer picks a greener option. For example, a software company helps reduce emissions by making remote work possible.
To be accurate, companies need a solid baseline to compare against. They must show what emissions would have been without their innovation. Without this clear analytical baseline, Scope 4 could be used to deceive rather than truly measure progress.
The Role of Innovation in Future Sustainability Frameworks
Innovation drives this change. By focusing on circular design and energy-saving tech, companies can change their clients’ carbon footprint. This makes businesses think about their impact on the global economy.
As reporting standards grow, Scope 4 will give a fuller picture of a company’s environmental value. It rewards those who make high-carbon habits outdated. The table below shows how these scopes differ in focus and responsibility.
Scope Category
Primary Focus
Accountability Level
Scope 1
Direct operational emissions
High (Direct control)
Scope 2
Purchased energy use
Moderate (Procurement)
Scope 3
Value chain impact
Complex (Influence)
Scope 4
Avoided emissions
Theoretical (Innovation)
Global Timelines: Parallels Between 2030 UNSDGs and 2050 Net Zero
Global progress is a balance between short-term goals and the big goal of cutting carbon by 2050. Companies see these dates as key steps, not just goals. By matching their plans with these global targets, they turn big climate promises into real success.
The 2030 Milestone: UN Sustainable Development Goals
The UN Sustainable Development Goals guide global efforts. These seventeen goals tackle poverty, inequality, and environmental harm. Reaching these by 2030 is key for a stable climate.
Companies that focus on Sustainable Development lay a strong base for growth. These early wins are crucial. They help build a solid base for deeper cuts in carbon emissions.
The 2050 Horizon: Long-term Decarbonization Strategies
By 2050, the goal is to reach Net Zero emissions. This long-term aim requires a big change in how industries use energy and resources. It’s a big test of corporate strength and strategic foresight.
The 2030 goals focus on quick Sustainable Development wins. But, the 2050 goal needs a complete change in the value chain. Companies that track their progress against the UN Sustainable Development Goals will be ready for a carbon-free world. These timelines help guide through a complex world.
Strategic Implementation of Carbon footprint reduction Scope 1, 2, 3 Carbon Neutral, Net Positive
Turning environmental goals into business wins starts with managing Scope 1, 2, and 3 emissions well. It’s not about big actions but the small, daily steps. By going beyond just following rules, companies can find new ways to save money and help the planet.
Best Practices for Measuring and Reporting
Accurate measurement is key to a strong climate plan. Companies should use frameworks like the Greenhouse Gas Protocol. This makes sure their carbon footprint reduction efforts are real and can be checked.
Being open about emissions is not just for rules. It builds trust with investors and customers. Good reporting needs a strong system to track emissions from start to finish. This helps spot and fix hidden problems.
Integrating Sustainability into Core Business Strategy
Real Net Positive impact comes when sustainability is part of the company’s mission. Instead of having a separate green team, successful companies make sustainable practices part of everything they do. This way, every part of the business helps reduce carbon.
Making sustainability a core part of strategy makes a business strong and ready for change. Companies that focus on this are better at handling climate risks and finding new green opportunities. Here’s a table showing the key steps in this journey.
Stage
Primary Focus
Strategic Outcome
Measurement
Data Collection
Baseline Accuracy
Reporting
Transparency
Stakeholder Trust
Integration
Operational Change
Competitive Advantage
Optimization
Net Positive Impact
Long-term Resilience
Conclusion
Dealing with carbon accounting is more than just tracking numbers. It’s about turning data into plans that meet global climate goals. Real progress means moving from just following rules to being truly accountable.
For businesses to succeed in a world focused on reducing carbon, they must lead by example. Companies like Patagonia and Microsoft show how making sustainability a core part of their work pays off. This approach helps them meet their ambitious goals for 2050.
The goal for companies should be to leave a positive mark on the environment. This means measuring and reducing all types of emissions. Doing so not only helps the planet but also gives businesses a competitive edge in a market that values sustainability.
Today, people want clear, measurable actions from companies, not just empty promises. By working with these standards, businesses can help achieve the United Nations’ Sustainable Development Goals by 2030. The future belongs to those who are ready to use data and innovation to make a difference.
Key Takeaways
Corporate climate accountability requires a deep understanding of emission categorization.
Distinguishing between various environmental targets is vital for strategic planning.
Scope frameworks provide the necessary structure for tracking organizational impact.
Global professionals must prioritize clarity over buzzwords to drive real change.
Effective sustainability strategies balance immediate actions with long-term systemic goals.
Welcome to our comprehensive exploration of sustainable solutions that transform environmental challenges into valuable assets. This article examines how innovative technologies are reshaping our approach to global development.
The modern world faces a curious paradox: what we once discarded as agricultural residue now holds remarkable potential. Through advanced conversion processes, these materials become powerful tools against climate change.
This analysis delves into the sophisticated relationship between ancient practices and modern science. We explore how controlled thermal decomposition creates permanent storage solutions while enhancing earth quality.
Our journey will reveal how integrated systems contribute to multiple global sustainability targets simultaneously. The transformation represents a paradigm shift in circular economy approaches to contemporary challenges.
Introduction to Sustainable Solutions: Green Energy and Waste Valorization
Modern environmental challenges present an ironic twist: the very materials causing problems also hold their solutions. This paradoxical relationship forms the foundation of contemporary sustainability approaches that transform liabilities into assets.
The current climate context demands more than incremental improvements. According to the Intergovernmental Panel on Climate Change, “the pace and scale of what has been done so far, and current plans, are insufficient to tackle climate change.” This assessment underscores the need for transformative rather than gradual solutions.
Defining the Circular Bioeconomy
A circular bioeconomy represents an economic system that eliminates discards through continuous biological resource utilization. This model fundamentally rethinks our relationship with organic materials, viewing them as perpetual value streams rather than temporary commodities.
Traditional linear models follow a take-make-dispose pattern that inevitably creates environmental burdens. The circular approach, by contrast, designs out waste through intelligent system thinking and technological innovation.
This framework understands discards not as problems but as undervalued resource opportunities. The sophisticated relationship between material valorization, nutrient cycling, and economic sustainability creates closed-loop systems that minimize environmental impact.
The Urgent Need for Integrated Climate and Waste Solutions
Current approaches often address climate and waste issues separately, missing crucial synergies. Integrated systems simultaneously tackle atmospheric carbon accumulation, resource depletion, and disposal challenges through unified strategies.
Biomass streams represent significant missed opportunities in conventional economic models. Proper management positions these materials as starting points for cascading environmental and economic benefits across multiple sectors.
The analytical framework presented here establishes how production processes epitomize circular economy principles in action. These systems demonstrate that what we once considered refuse actually contains the seeds of its own solution through clever valorization techniques.
This approach’s role in global development cannot be overstated. It offers a pathway where environmental responsibility and economic progress become mutually reinforcing rather than competing objectives.
What is Biomass? Understanding the Foundation of Biochar
Nature presents us with an elegant paradox: the very materials we once considered worthless now form the bedrock of transformative environmental solutions. This section examines the diverse organic substances that serve as the fundamental building blocks for advanced carbon conversion systems.
At its core, biomass represents organic matter derived from living or recently living organisms. These materials span agricultural, forestry, urban, and animal sources, each with unique characteristics that influence their conversion potential.
Agricultural Residues: From Crop Waste to Resource
The farming sector generates substantial residual materials that traditionally posed disposal challenges. Rice husks, corn stalks, and nut shells represent typical examples of these agricultural byproducts.
Through innovative processing, these residues transform from burdensome waste into valuable feedstock. This conversion exemplifies the circular economy principle where nothing goes to waste.
Forestry Waste: Utilizing Wood Byproducts
Timber operations produce significant amounts of unused woody materials. Sawdust, tree bark, and wood chips often accumulate as processing remnants with limited traditional use.
These forestry materials possess excellent properties for thermal conversion processes. Their consistent composition and carbon density make them ideal candidates for value creation.
Urban and Animal-Derived Biomass Streams
Municipal systems generate organic materials that typically end in landfills. Paper mill sludge, yard trimmings, and food scraps represent underutilized urban biomass sources.
Animal agriculture contributes manure and other agricultural byproducts that can be converted to stable carbon. These materials offer dual benefits of waste reduction and resource creation.
Biomass Category
Common Examples
Conversion Suitability
Annual Availability (US)
Agricultural Residues
Corn stalks, rice husks, nut shells
High carbon content, uniform composition
~400 million tons
Forestry Waste
Sawdust, bark, wood chips
Excellent thermal properties, consistent
~230 million tons
Urban Biomass
Yard trimmings, food waste, sludge
Variable composition, requires processing
~180 million tons
Animal-Derived
Manure, agricultural byproducts
High nutrient content, moisture management
~150 million tons
The selection of appropriate feedstock proves critical for both environmental integrity and economic viability. Different biomass types require tailored processing parameters for optimal results.
This diversity enables decentralized production models that can adapt to local availability. The sophisticated understanding of biomass characteristics forms the foundation for effective carbon management systems.
Biochar 101: The Powerful Waste-to-Carbon Technology
Industrial innovation has achieved a remarkable inversion: converting liabilities into assets. This section explores how thermal conversion transforms organic materials into stable carbon with multiple environmental benefits.
The production process represents a sophisticated approach to material valorization. Through controlled thermal decomposition, what was once considered refuse becomes a valuable resource for environmental applications.
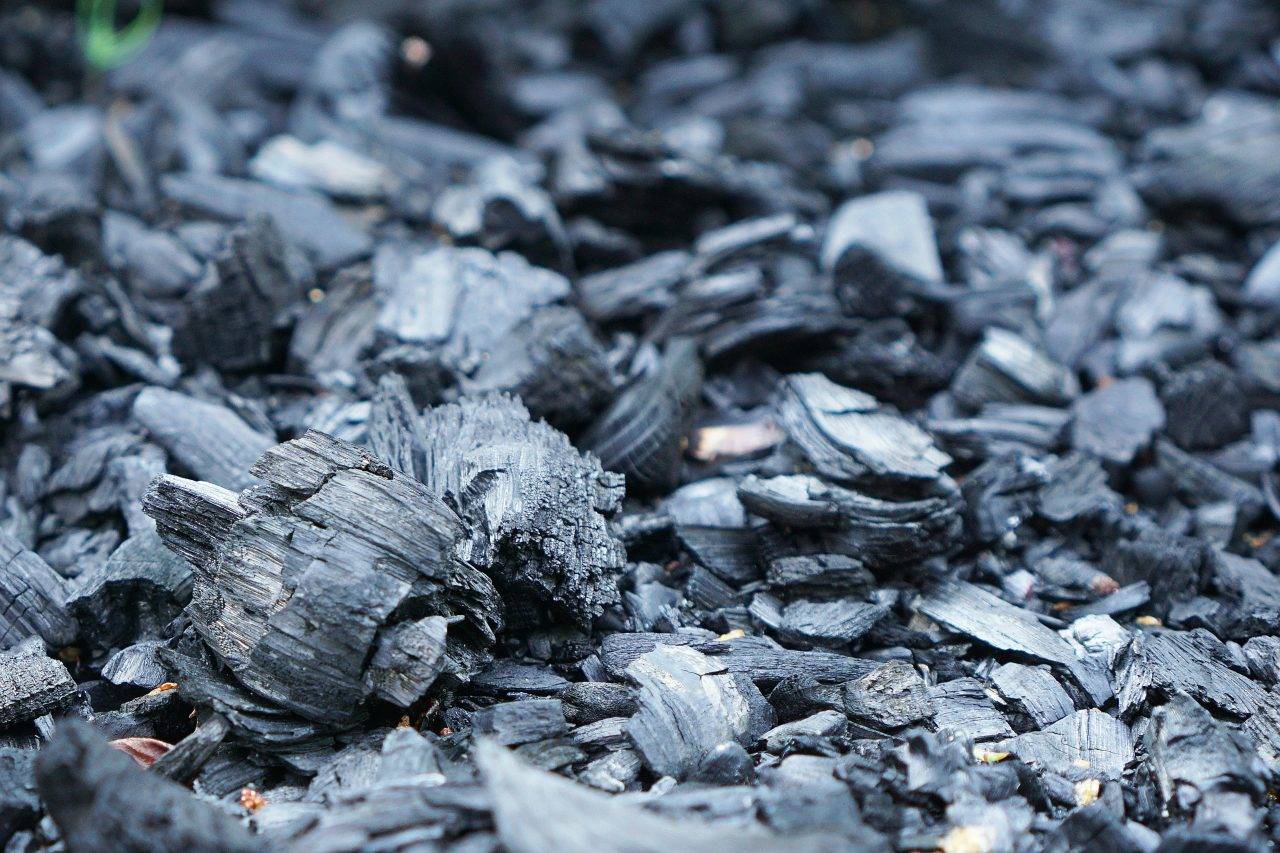
Biochar vs. Charcoal: Key Differences in Purpose and Production
While superficially similar, these materials serve fundamentally different purposes. Charcoal targets combustion energy release, while biochar focuses on long-term environmental applications.
The manufacturing intent separates these carbon-rich materials completely. One seeks temporary heat generation; the other aims for permanent environmental enhancement through stable carbon integration.
The Science of Pyrolysis: Transforming Organic Matter
Pyrolysis operates through thermal decomposition without combustion. This oxygen-limited environment prevents complete material breakdown, creating stable carbon structures instead.
Temperature parameters critically influence the final product’s characteristics. Different heating ranges produce varying bio-oil, syngas, and solid carbon ratios from the same starting materials.
The process demonstrates elegant simplicity masking sophisticated environmental benefits. This thermal conversion simultaneously addresses waste reduction and carbon management challenges through integrated solutions.
Different biomass types respond uniquely to pyrolysis conditions. This variability requires careful process adjustment to optimize output quality and environmental performance.
The resulting material offers exceptional stability as a permanent carbon repository. Its molecular structure resists decomposition, making it ideal for long-term environmental applications.
This technology bridges disposal challenges with climate solution opportunities. It represents a practical approach where environmental responsibility meets technological innovation effectively.
The Production Process: From Waste Biomass to Stable Carbon
Manufacturing presents an intriguing dichotomy where technological sophistication meets grassroots ingenuity. This transformation journey spans from village workshops to industrial complexes, each with distinct advantages and limitations.
The conversion pathway demonstrates how simple thermal principles can yield complex environmental benefits. Different approaches serve diverse market segments while addressing common sustainability challenges.
Artisanal Production: Community-Scale Kilns and Benefits
Small-scale operations empower local communities through accessible technology. These systems typically utilize modified barrel designs or brick constructions.
Village-level manufacturing offers significant social advantages. It creates local employment opportunities while utilizing readily available feedstock materials.
Quality consistency remains the primary challenge for artisanal operations. Without sophisticated monitoring equipment, output characteristics may vary between batches.
Emission control represents another consideration for small-scale setups. Basic designs may not capture all process gases effectively.
Industrial Production: High-Tech Reactors for Scalability
Large facilities employ continuous-feed pyrolysis reactors for maximum throughput. These automated systems maintain precise temperature controls throughout operation.
Standardized output quality becomes the hallmark of industrial manufacturing. Sophisticated monitoring systems ensure consistent product specifications batch after batch.
Feedstock logistics present the greatest challenge at this scale. Sourcing sufficient organic materials requires extensive supply chain management.
The capital investment for industrial plants significantly exceeds artisanal setups. However, operational efficiency offsets initial costs through higher production volumes.
Critical Production Parameters: Temperature and Output
Thermal conditions fundamentally determine the final product’s characteristics. Temperature ranges between 400-700°C produce vastly different material properties.
Residence time and heating rate equally influence the conversion outcome. Faster heating typically yields more liquid byproducts versus solid carbon.
The relationship between input materials and output quality remains paramount. Different organic substances require tailored processing parameters for optimal results.
Production Scale
Typical Capacity
Capital Investment
Quality Consistency
Emission Control
Community Impact
Artisanal/Kiln
1-10 tons/month
$2,000-20,000
Variable
Basic
High
Medium-Scale
10-100 tons/month
$50,000-500,000
Moderate
Standard
Medium
Industrial
100+ tons/month
$1M+
High
Advanced
Low
Temperature thresholds above 550°C ensure maximum carbon stability in the final product. This thermal range promotes aromatic condensation reactions that create persistent molecular structures.
The manufacturing approach selection balances technical requirements with social considerations. Neither scale inherently outperforms the other—they serve different purposes within the broader sustainability landscape.
Process optimization requires understanding both technical parameters and practical constraints. The most effective systems combine scientific precision with operational practicality.
Why Biochar is a Superior and Permanent Carbon Sink
Elemental composition tells a compelling story of longevity that defies conventional decomposition timelines. This material’s exceptional durability positions it among nature’s most effective carbon management solutions.
The distinction between temporary and permanent storage separates superficial approaches from genuinely transformative climate solutions. Not all carbon capture methods offer equivalent environmental benefits or longevity.
The Science of Carbon Sequestration and Storage
Carbon removal technologies vary dramatically in their permanence and effectiveness. Some approaches temporarily store atmospheric carbon while others create near-permanent repositories.
Biochar represents the latter category through its unique molecular structure. The pyrolysis process creates aromatic carbon rings that resist microbial breakdown and chemical degradation.
This stability stems from the thermal conversion’s effect on organic materials. High temperatures rearrange molecular bonds into configurations that nature struggles to decompose.
Assessing Permanence: H/C and O/C Ratios
Laboratory analysis provides quantitative measures for predicting environmental persistence. Scientists use simple elemental ratios to forecast complex long-term behavior.
The hydrogen-to-carbon (H/C) and oxygen-to-carbon (O/C) ratios serve as reliable indicators. Materials meeting H/C ≤ 0.4 and O/C ≤ 0.2 demonstrate exceptional durability characteristics.
These thresholds represent critical boundaries for carbon permanence certification. Materials exceeding these values undergo more rapid decomposition in environmental conditions.
The irony lies in how elementary measurements predict sophisticated environmental performance. Simple laboratory tests can forecast whether carbon will persist for decades or millennia.
This analytical rigor forms the foundation of carbon credit certification standards. Projects must demonstrate these chemical characteristics to qualify as permanent removal solutions.
Long-Term Stability in Soil and Other Applications
Research confirms remarkable persistence across diverse environmental conditions. Studies document carbon remaining stable for over 1,000 years in various applications.
Soil incorporation represents the most common use case for this durable material. The carbon integrates with earth components while maintaining its structural integrity.
Beyond agricultural applications, researchers explore construction materials and filtration systems. These alternative uses leverage the same permanence characteristics for different environmental benefits.
The material’s persistence outperforms other nature-based carbon solutions significantly. Forest growth and soil organic matter provide valuable but less durable storage options.
This superior permanence meets the strictest requirements for climate accounting frameworks. It represents one of few solutions that genuinely qualify as permanent carbon removal.
Green Energy and Biomass: The Synergy of Carbon Removal and Renewable Heat
Thermal conversion achieves an elegant duality where environmental remediation generates valuable byproducts. This process transforms organic materials while capturing excess thermal output for practical applications.
The pyrolysis reaction liberates substantial thermal energy alongside solid carbon creation. This surplus represents an often-overlooked co-benefit that enhances overall system efficiency.
Harnessing Surplus Energy from Pyrolysis
Modern reactors capture and utilize thermal output that would otherwise dissipate. This recovered energy can power adjacent operations or supply external consumers.
The quantity and quality of energy output vary with feedstock characteristics. Denser materials typically yield higher thermal values per unit processed.
Sophisticated heat exchange systems maximize energy capture efficiency. These configurations transform what was once waste heat into valuable renewable resources.
Decarbonizing Industrial Heat and District Systems
Industrial thermal demands represent significant emission sources globally. Pyrolysis facilities can supply carbon-neutral heat to manufacturing operations through direct partnerships.
District heating networks benefit particularly from consistent thermal output. These community-scale systems require reliable baseload supply that matches well with continuous pyrolysis operations.
The Heat-as-a-Service model offers intriguing advantages for both producers and consumers. Long-term contracts provide price stability while guaranteeing renewable energy supply.
This approach demonstrates how integrated thinking creates multiple value streams. One process simultaneously addresses organic material management, carbon sequestration, and renewable energy generation.
The scalability of these integrated systems supports broader energy transition goals. From small community installations to industrial complexes, the model adapts to various contexts and requirements.
Financial models must account for both carbon credits and energy sales to accurately reflect total value. This dual-revenue structure enhances project economics while maximizing environmental benefits.
Certification and Standards: Ensuring Environmental Integrity
Environmental verification presents an ironic paradox: the very solutions designed to save our planet require extensive proof of their worth. This validation ecosystem ensures that climate technologies deliver measurable benefits rather than merely promising theoretical advantages.
The certification landscape has evolved into a sophisticated framework of independent assessment. These protocols guard against greenwashing while establishing credible benchmarks for environmental performance.
Leading Methodologies: Puro.earth, VCS-Verra, and EBC
Several prominent standards have emerged as industry benchmarks for carbon removal validation. Puro.earth focuses specifically on engineered carbon removal methods with rigorous permanence requirements.
VCS-Verra brings decades of carbon market experience to its methodology development. The European Biochar Certificate (EBC) and World Biochar Certificate (WBC) provide comprehensive frameworks covering production quality and environmental impact.
Each program addresses different aspects of project development and verification. Some emphasize carbon accounting while others focus on product quality and safety standards.
The selection of appropriate methodology depends on project scale and intended markets. International recognition often requires compliance with multiple certification frameworks.
The Role of Life-Cycle Assessment in Project Validation
Life-Cycle Assessment (LCA) provides the analytical foundation for credible carbon accounting. This systematic approach quantifies environmental impacts across a project’s entire lifespan.
ISO 14040/44 standards govern proper LCA implementation for carbon removal projects. The cradle-to-grave methodology accounts for all emissions from feedstock collection to final application.
Third-party verification of LCA results ensures methodological rigor and accuracy. This independent review prevents overestimation of net carbon benefits while identifying optimization opportunities.
The sophistication of LCA analysis has become increasingly important for market credibility. Comprehensive assessments now include social and economic impacts alongside environmental metrics.
Third-Party Verification for Credibility and Trust
Independent validation serves as the critical bridge between innovation and market acceptance. Third-party auditors bring objectivity and expertise that internal assessments cannot match.
The verification process examines every aspect of project implementation and documentation. Auditors assess feedstock sustainability, additionality, and monitoring protocols against methodology requirements.
This external scrutiny ultimately enhances project value and investor confidence. Verified credits command premium prices in carbon markets due to their demonstrated integrity.
The evolving standards landscape continues to adapt to new technological applications. Certification frameworks now address diverse use cases from agricultural enhancement to construction materials.
Quality assurance through rigorous verification represents essential protection for climate impact integrity. Rather than bureaucratic hurdles, these standards provide the foundation for scalable, trustworthy carbon markets.
Revitalizing the Earth: The Impact of Biochar on Soil Health
The relationship between stable carbon and earth vitality demonstrates how environmental solutions can address multiple challenges simultaneously. This integrated approach transforms carbon management into a comprehensive strategy for agricultural enhancement.
Research reveals that carbon-rich amendments deliver benefits extending far beyond atmospheric carbon reduction. These materials fundamentally alter soil characteristics in ways that support sustainable agricultural practices.
Enhancing Water Retention and Nutrient Availability
The porous nature of these carbon materials creates exceptional water-holding capacity. This sponge-like characteristic reduces irrigation requirements significantly during dry periods.
Farmers observe reduced water stress in crops treated with these amendments. The material captures moisture during rainfall and releases it gradually to plant roots.
Nutrient management undergoes similar improvement through cation exchange capacity enhancement. Fertilizers become more effective as nutrients remain available rather than leaching away.
This slow-release mechanism represents a sophisticated approach to nutrient cycling. Plants receive consistent nourishment while reducing fertilizer application frequency.
Improving Soil Microbiology and Structure
Microbial communities flourish in the presence of carbon amendments. The porous structure provides ideal habitat conditions for beneficial microorganisms.
Soil biology diversity increases dramatically following application. This microbial enhancement supports natural nutrient cycling and disease suppression.
Physical structure improvement represents another critical benefit. Heavy soils become more workable while sandy soils gain better cohesion and moisture retention.
The material’s stability ensures long-term structural benefits without frequent reapplication. This permanence distinguishes it from organic amendments that decompose rapidly.
Boosting Agricultural Productivity and Resilience
Crop yields demonstrate consistent improvement across diverse growing conditions. Studies show average yield increases of 10-25% following proper application.
Drought resistance improves significantly due to enhanced water retention capabilities. Plants withstand water stress more effectively, reducing crop failure risk.
The economic benefits for farmers become apparent through reduced input costs and improved output. Fertilizer requirements decrease while crop quality and quantity increase.
Long-term studies confirm sustained improvements years after initial application. This durability makes the investment economically viable for agricultural operations.
Contaminated land remediation represents another valuable application. Heavy metals and pollutants become immobilized, restoring land to productive use.
The multifaceted benefits position this approach as a comprehensive solution for modern agriculture. It addresses productivity, sustainability, and resilience simultaneously.
Transforming Waste Byproducts into Environmental Assets
Economic systems reveal an intriguing contradiction: materials once considered worthless now drive environmental innovation. This paradigm shift represents one of modern sustainability’s most compelling developments, where disposal challenges become value creation opportunities.
The transformation process fundamentally reimagines our relationship with organic discards. Rather than viewing these substances as problems requiring management, advanced systems recognize their inherent potential for environmental benefit.
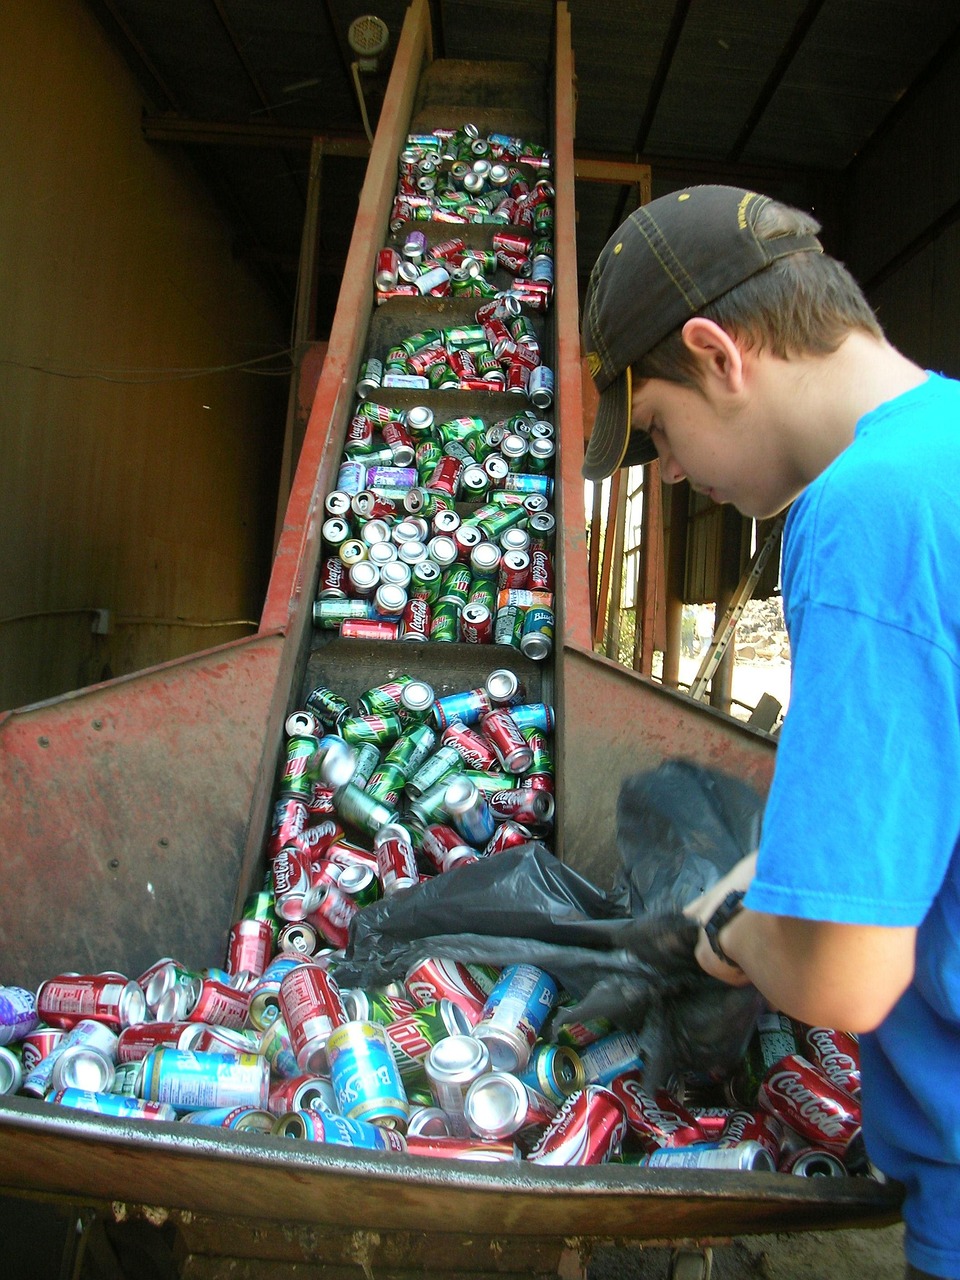
Diverting Organic Waste from Landfills and Incineration
Current disposal methods create significant environmental burdens despite their widespread use. Landfills generate methane emissions while incineration releases atmospheric pollutants from otherwise valuable materials.
The scale of organic discards destined for conventional disposal methods remains staggering. Approximately 60% of municipal solid waste consists of compostable organic materials that could undergo valorization instead.
Methane emissions from landfills represent particularly concerning environmental impacts. This potent greenhouse gas possesses 28-36 times the warming potential of carbon dioxide over a century.
Analytical approaches calculate avoided emissions through diversion strategies. These methodologies account for both direct emission reductions and secondary environmental benefits from material repurposing.
Creating Value from what was Once a Liability
The economic transformation proves equally remarkable as the environmental benefits. Systems that previously consumed resources for waste management now generate revenue through clever material processing.
Different organic streams require tailored approaches for optimal valorization. Agricultural residues demand different handling than urban organic materials or industrial byproducts.
Integrated management systems prioritize highest-value utilization pathways for each material type. This sophisticated understanding maximizes both economic returns and environmental benefits.
The circular economy model fundamentally repositions organic discards within economic systems. Materials complete full cycles from production to consumption to reintegration rather than linear disposal.
Waste Stream
Current Disposal Method
Valorization Potential
Methane Reduction Potential
Economic Value Created
Agricultural Residues
Open burning/field decomposition
High carbon content
85-90% reduction
$50-150/ton
Food Waste
Landfilling
Medium nutrient value
95% reduction
$30-80/ton
Yard Trimmings
Composting/landfilling
High bulk density
75-85% reduction
$40-100/ton
Wood Processing Waste
Incineration/landfilling
Excellent thermal properties
80-90% reduction
$60-120/ton
Policy frameworks play crucial roles in incentivizing these transformations at scale. Regulatory structures must evolve to support rather than hinder waste-to-resource conversions.
The economic case becomes increasingly compelling as technology advances and markets develop. Viewing organic discards as resources rather than waste represents both environmental necessity and economic opportunity.
This approach simultaneously addresses waste reduction and climate objectives through integrated solutions. The sophisticated relationship between material management and environmental protection creates powerful synergies.
Biochar’s Pivotal Role in Achieving the UNSDGs
Global development frameworks present an interesting contradiction where single solutions can address multiple objectives simultaneously. This integrated approach represents a sophisticated departure from traditional single-issue interventions that dominated previous sustainability efforts.
The material’s unique characteristics position it as a rare multi-tool in the sustainability arsenal. Rather than addressing isolated challenges, it creates cascading benefits across diverse development domains through clever system integration.
SDG 2: Zero Hunger through Sustainable Agriculture
Agricultural productivity gains demonstrate the technology’s immediate practical value. Studies show consistent yield improvements of 10-25% across various crops and growing conditions.
This enhancement stems from multiple mechanisms working together. Improved water retention, nutrient availability, and soil structure create optimal growing environments.
The economic benefits for smallholder farmers prove particularly significant. Reduced input costs combined with increased output create sustainable livelihood improvements.
SDG 6: Clean Water and Sanitation via Pollution Filtration
Water purification applications leverage the material’s exceptional adsorption properties. Heavy metals, pesticides, and other contaminants bind effectively to its porous surface.
This filtration capability addresses both point-source and diffuse pollution challenges. Industrial wastewater and agricultural runoff both benefit from treatment applications.
Developing regions gain particular advantages from low-cost filtration options. Simple systems using locally produced materials provide accessible water quality solutions.
SDG 7: Affordable and Clean Energy from Pyrolysis
The thermal conversion process generates surplus energy alongside solid carbon production. This renewable heat can power adjacent operations or supply external consumers.
Decentralized energy generation supports community-level energy security. Smaller pyrolysis units can provide thermal energy for local industries or district heating systems.
This integrated approach demonstrates remarkable efficiency in resource utilization. One process simultaneously manages organic materials while creating valuable energy outputs.
SDG 13: Climate Action through Direct Carbon Removal
Carbon sequestration represents the most direct climate contribution. The stable carbon form persists for centuries, providing genuine permanent storage.
This permanence qualifies the approach under stringent carbon accounting frameworks. It meets criteria that many nature-based solutions cannot satisfy regarding durability.
The technology’s scalability supports broader climate mitigation targets. From small community projects to industrial operations, it adapts to various implementation contexts.
Additional sustainable development goals benefit indirectly from widespread adoption. Decent work creation, sustainable cities, and terrestrial ecosystem protection all receive support.
Measurement frameworks continue evolving to quantify these diverse contributions accurately. Standardized reporting protocols ensure credible claims regarding multiple objective advancement.
Policy makers increasingly recognize technologies that deliver across multiple sustainability domains simultaneously. This multi-benefit approach represents efficient resource allocation for development priorities.
The 2030 Agenda implementation benefits from practical solutions that bridge environmental and social objectives. Integrated approaches like this demonstrate how clever thinking can address complex challenges effectively.
Social and Economic Co-Benefits of a Biochar Economy
Economic development reveals an intriguing inversion where traditionally disadvantaged areas become hubs of environmental innovation. This transformation creates value chains that extend far beyond carbon management into community revitalization and job creation.
The social dimension of these systems demonstrates how environmental solutions can drive comprehensive regional development. Rather than focusing solely on technical outcomes, successful projects integrate human and economic factors.
Job Creation in Rural and Remote Communities
Employment opportunities emerge across the entire value chain from collection to application. These positions range from technical roles to logistical support and field implementation.
Remote regions with limited economic alternatives benefit particularly from decentralized production models. Companies like Novocarbo strategically locate Carbon Removal Parks in areas needing employment diversification.
Training programs develop local expertise in sustainable practices and technical operations. This knowledge transfer creates lasting capacity beyond individual project timelines.
The ironic development pattern positions marginalized regions as centers of climate innovation. Areas once overlooked now host cutting-edge environmental technology operations.
Economic Growth through Innovation and Local Sourcing
Local biomass sourcing creates circular economic models that retain value within communities. Farmers and landowners receive payments for materials previously considered waste products.
Innovative business models ensure benefits are shared across stakeholders rather than concentrated. This approach builds community support and enhances project sustainability.
Distribution networks for final products create additional entrepreneurial opportunities. The economic multiplier effect extends through transportation, retail, and application services.
Measurement frameworks now capture social return on investment alongside environmental metrics. This analytical approach quantifies community benefits that traditional accounting might overlook.
The sophisticated understanding of integrated value creation positions these initiatives as comprehensive development strategies. They address environmental challenges while building resilient local economies.
Community acceptance becomes essential for long-term project success and scaling. Projects designed with local input typically achieve better outcomes than externally imposed solutions.
Scaling Up: Implementation Strategies for Communities and Industry
Implementation paradoxically demands both expansion and localization simultaneously. This delicate balance represents the core challenge in transforming theoretical potential into practical impact across diverse contexts.
The scaling dilemma presents an interesting contradiction where success requires standardized processes and customized approaches. Effective implementation bridges this gap through sophisticated understanding of local conditions and technical requirements.
Project Development from Concept to Operation
Successful initiatives begin with comprehensive feasibility assessment. This analytical phase examines feedstock availability, market dynamics, and regulatory frameworks.
The development process progresses through detailed engineering design and financial modeling. Each stage requires careful validation against both technical specifications and community needs.
Commissioning represents the critical transition from planning to execution. This phase tests equipment performance and operational protocols under real-world conditions.
Ongoing operation demands continuous monitoring and optimization. Performance tracking ensures environmental integrity while maximizing economic returns.
Overcoming Logistical and Technical Barriers
Feedstock collection presents the first major logistical challenge. Efficient systems must balance collection radius with transportation costs and material quality.
Storage and handling require careful management to prevent degradation. Different organic materials demand specific conditions to maintain conversion suitability.
Technical barriers often involve equipment reliability and process consistency. These challenges vary significantly between artisanal and industrial operations.
Community engagement proves equally important as technical excellence. Local support facilitates smoother implementation and long-term sustainability.
The sophisticated approach to barrier resolution combines engineering solutions with social understanding. This dual perspective addresses both mechanical and human factors effectively.
Implementation excellence ultimately determines whether promising technologies achieve meaningful impact. The bridge between innovation and application requires both technical precision and contextual intelligence.
The Investment Landscape: Carbon Markets and Project Viability
Financial markets demonstrate an intriguing paradox where environmental protection becomes economically viable through clever market mechanisms. This sophisticated relationship between climate action and investment returns represents one of modern sustainability’s most fascinating developments.
The carbon credit ecosystem has evolved into a complex financial marketplace. Projects must navigate rigorous validation processes while demonstrating both environmental integrity and economic sustainability.
Understanding Additionality in Carbon Credit Projects
Additionality stands as the cornerstone of credible climate finance. This concept ensures that carbon credits represent genuine environmental benefits rather than business-as-usual activities.
Projects must satisfy three distinct additionality criteria to qualify for carbon markets. Environmental additionality requires proving that biomass would have emitted CO₂ if not processed through thermal conversion.
Financial additionality demonstrates that carbon credits are essential for project viability. Regulatory additionality confirms that no existing laws mandate the activity being undertaken.
The analytical rigor behind additionality verification prevents market distortions. This thorough examination separates legitimate climate contributions from opportunistic claims.
Financial Models and the Role of Carbon Finance
Successful initiatives combine multiple revenue streams for economic resilience. Carbon credit sales typically complement product revenue and energy value creation.
The investment case rests on carbon removal permanence and co-benefits valuation. Projects must demonstrate both immediate financial returns and long-term environmental impact.
Innovative financing structures help de-risk investment in emerging technologies. These models balance investor protection with project development needs.
The evolving regulatory landscape continues to shape carbon credit demand and pricing. Policy developments directly impact project viability and investment attractiveness.
Carbon markets serve as essential enabling mechanisms for scaling climate solutions. They bridge the gap between environmental necessity and economic practicality through sophisticated market design.
Project developers must navigate complex certification requirements while maintaining operational efficiency. This balancing act requires both technical expertise and financial acumen.
The future of climate finance depends on robust, transparent carbon markets. These systems transform environmental responsibility into economic opportunity through clever market architecture.
Future Trends and Innovations in Biochar Technology
Technological evolution demonstrates an interesting reversal where traditional materials find revolutionary applications. The innovation frontier constantly expands beyond conventional uses into unexpected sectors.
Research institutions and private companies collaborate to unlock new potential. These partnerships accelerate development across diverse industries.
Emerging Applications in Construction and Filtration
Building materials represent a promising new application area. Adding carbon-rich substances to concrete reduces embodied emissions significantly.
These composite materials demonstrate enhanced insulation properties. They also improve moisture regulation within structures.
Water treatment systems benefit from exceptional adsorption capabilities. Heavy metals and organic pollutants bind effectively to porous surfaces.
Municipal filtration installations show remarkable efficiency improvements. The material’s longevity ensures sustained performance without frequent replacement.
Industrial wastewater management adopts these filtration solutions. They offer cost-effective alternatives to conventional treatment methods.
Advances in Pyrolysis Technology and Efficiency
Modern reactors achieve unprecedented thermal efficiency. Advanced heat recovery systems capture more energy from each conversion cycle.
Automation improves consistency across production batches. Sophisticated sensors maintain optimal temperature parameters throughout operation.
Modular designs enable scalable deployment across different settings. Smaller units serve community needs while larger installations supply industrial demand.
Continuous-feed systems enhance operational productivity. They reduce downtime between processing cycles significantly.
Quality control mechanisms become increasingly sophisticated. Real-time monitoring ensures output meets strict specifications consistently.
The innovation pipeline extends from laboratory concepts to commercial applications. Research collaborations accelerate technology transfer across global markets.
Cost reduction remains essential for broader adoption. Efficiency improvements make these solutions more accessible to diverse users.
Integrated systems maximize value extraction through cascading utilization. Multiple applications ensure comprehensive resource optimization.
Getting Involved: How to Support and Integrate Biochar Solutions
Market participation reveals an elegant symmetry where diverse stakeholders converge around shared environmental objectives. This collaborative ecosystem demonstrates how individual actions collectively drive systemic change through coordinated engagement.
The pathway to involvement varies significantly across different participant categories. Each group contributes unique value while benefiting from distinct advantages.
Options for Farmers, Businesses, and Policymakers
Agricultural producers can implement these materials through straightforward application methods. Many operations begin with purchased amendments to test effectiveness before considering on-site production.
Farm-based manufacturing represents the next logical progression for larger operations. Small kilns enable growers to convert crop residues directly into valuable soil enhancements.
Commercial enterprises discover opportunities throughout the value chain. From biomass collection to final product distribution, numerous business models support economic viability.
Policy makers wield significant influence through regulatory frameworks and incentive structures. Strategic interventions can accelerate adoption while ensuring environmental integrity.
ClimateSeed supports building diversified carbon project portfolios that include high-quality initiatives. Their approach ensures projects meet rigorous standards while delivering tangible benefits for climate and communities.
Building a Diversified Carbon Project Portfolio
Investment strategies benefit from thoughtful diversification across project types and geographies. This analytical approach balances risk while maximizing environmental impact.
Different project scales serve distinct investment objectives effectively. Small community initiatives offer social co-benefits while large industrial operations provide scale efficiencies.
Partnership models connect stakeholders across the ecosystem strategically. These collaborations leverage complementary strengths for comprehensive solution development.
Implementation support services address critical development phases comprehensively. From certification to operational management, professional assistance enhances project success.
Stakeholder Group
Primary Engagement Options
Investment Range
Implementation Timeline
Support Services Needed
Farmers
Application only, On-farm production
$5,000-50,000
1-6 months
Technical training, Application guidance
Businesses
Value chain participation, Project development
$100,000-5M
6-24 months
Market analysis, Certification support
Policymakers
Incentive programs, Regulatory frameworks
Varies by jurisdiction
12-36 months
Impact assessment, Policy design
Investors
Project financing, Portfolio development
$500,000-10M
3-18 months
Due diligence, Risk management
The sophisticated understanding of engagement pathways creates resilient participation models. Stakeholder involvement proves essential for developing inclusive markets that serve diverse needs.
Practical implementation begins with assessment of local conditions and available resources. This foundation ensures appropriate solution selection matched to specific circumstances.
The integration journey typically progresses from simple adoption to comprehensive implementation. This gradual approach allows learning and adjustment throughout the process.
Successful engagement requires both technical knowledge and relationship building. The most effective initiatives combine scientific precision with community collaboration.
Conclusion: Integrating Biomass and Biochar for a Sustainable Future
Sustainable development presents a fascinating duality where challenges contain their own remedies. This integrated approach transforms liabilities into assets through clever technological applications.
The analysis demonstrates how organic materials become valuable resources. These solutions address multiple environmental objectives simultaneously.
Proper management creates cascading benefits across ecosystems. It supports global development while enhancing natural systems.
Future progress depends on scaling these integrated approaches. Stakeholders across sectors must embrace practical, permanent climate strategies.
Key Takeaways
Agricultural residues can be converted into valuable environmental resources
Modern technology combines ancient practices with contemporary science
This Ultimate Guide frames how price signals, compliance schemes, voluntary credits, and renewables fit for U.S. decision-makers and international planners.
The landscape hit a record in 2022: revenues neared USD 100 billion and EU allowances reached €100. Yet most emissions still trade at modest levels; fewer than 5% face prices near the $50–$100/tCO2 range suggested for 2030.
Readers will get clear, practical steps on procurement choices—unbundled renewables, PPAs, and green tariffs—and guidance on integrity standards such as Core Carbon Principles and CORSIA. The piece contrasts direct instruments (tax and ETS) with hybrid standards and voluntary instruments that complement compliance systems.
Expect concise analysis of supply trends: renewables drove most credit issuance, nature-based registrations rose, and removals technology is growing under stricter quality screens. U.S.-specific notes touch on RGGI, SREC differences by state, and the federal solar ITC through 2032.
Carbon pricing at present: where markets, taxes, and credits stand now
Today’s price signals mix steady market gains with glaring coverage gaps that shape near-term decisions.
What a “price on carbon” means today for climate and energy decisions
A price on carbon is a monetary signal embedded in consumption and production choices; it nudges investment toward low-emitting assets and away from legacy polluters.
The tool works by raising the cost of emissions and making abatement economically visible. In 2022 revenues approached nearly USD 100 billion, while the EU ETS breached a symbolic €100 level — proof that robust signals can persist despite shocks.
Coverage versus price: why both matter for impact
Impact requires two levers: sufficient price levels to change marginal decisions, and broad coverage so a large share of emissions respond.
About 23% of global emissions were under ETS or levy systems by April 2023.
Fewer than 5% of ghg emissions faced direct prices in the $50–$100/tCO2 band, so many sectors remain exposed.
Markets and credits (compliance vs voluntary) both influence cost curves; only direct pricing enforces statutory abatement. Corporates should set internal price signals, align procurement, and rely on quality offsets to bridge near-term gaps. Solid data tracking is essential to forecast exposure and hedge procurement risks.
The pillars of pricing: carbon taxes, ETS, and hybrid systems
The policy toolkit breaks into three practical choices: a per‑unit levy, a capped allowance market, and hybrids that mix benchmarks with trading. Each design shapes incentives and risk differently for firms and regulators.
Carbon tax fundamentals and current ranges in practice
A tax sets a transparent per‑ton price on emissions (or fuel). It is easy to administer and makes revenue predictable; governments can return funds as dividends or cut other levies.
Examples include Singapore’s planned rise to about USD 38–60 from 2026 and Canada’s pathway toward roughly USD 127 by 2030. Higher‑income jurisdictions often reach prices above $50 per tonne; middle‑income ones pilot lower levels while building measurement systems.
Emissions Trading Systems: caps, allowances, and trading
ETS create a cap on total emissions; regulators issue allowances (EUAs, UKAs, NZUs, KAU) that firms buy, sell, or bank. The cap delivers quantity certainty while markets reveal marginal abatement costs.
Hybrid models: OBPS, EPS, and regional cap-and-trade like RGGI
Hybrids try to shield trade‑exposed sectors. Output‑based performance standards (OBPS) and emissions performance standards (EPS) set benchmarks instead of pure per‑unit charges.
RGGI auctions allowances and directs proceeds to regional programs.
Hybrids reduce leakage but add design complexity and reliance on strong MRV for compliance.
Global price signals and coverage by region, based on World Bank 2023
Regional price bands reveal as much about institutional capacity as they do about political will. As of April 2023, 73 instruments covered roughly 23% of emissions worldwide. Yet less than 5% of ghg emissions faced a high‑level signal in the $50–$100/tCO2 range.
High-income versus middle-income bands
High‑income jurisdictions often cluster above $50 per ton; the european union’s ETS even hit €100, reinforcing strong market responses and revenue recycling.
Middle‑income systems mostly price under $10. Exceptions—Beijing and Guangdong pilots, Mexico’s subnational measures, and Latvia’s tax—show how pilots build MRV and administrative muscle.
Why coverage matters as much as price
A high signal on a sliver of emissions is not the same as modest signals applied broadly. A $75/t signal on 5% of emissions underperforms a $25/t signal covering half the economy when the goal is near‑term structural change.
Constraints: fossil fuel subsidies and energy volatility can blunt signals.
Capacity: MRV and admin readiness are gating factors for expansion.
Implication: closing the
Revenues from carbon pricing: record highs and how funds are used
Governments saw nearly USD 100 billion arrive from emissions-related instruments in 2022, shifting the budget conversation.
Most of that cash came from traded allowances rather than direct levies. About 69% of receipts were generated by ETS mechanisms, while roughly 31% came from tax-based schemes. The EU’s system alone produced about $42 billion in 2022 — nearly seven times its 2017 level — as auctioning replaced free allocation.
How countries recycle proceeds
Use of funds varies but trends are clear: roughly 46% of revenue is earmarked for targeted programs, 29% flows to general budgets, 10% serves as direct transfers (social cushioning), and 9% offsets other taxes.
Revenue Source
Share (2022)
Main Uses
ETS (auctioning)
69%
Clean energy, innovation, adaptation
Tax-based levies
31%
Budget support, rebates, targeted transfers
EU auctioning
$42B
Market tightening, transition aid, R&D
Policy implications
Predictable recycling improves public support and compliance. In the U.S., RGGI shows how reinvestment in efficiency and community programs builds durability.
Yet revenues remain price‑sensitive: allowance downturns or tax adjustments can cut fiscal inflows and weaken program credibility. Sound data tracking and transparent use of proceeds help stabilize expectations for investors and households alike.
Compliance markets around the world: EU ETS, China ETS, UK, K-ETS, NZ, Australia
Compliance markets now form the backbone of many national climate strategies; each system creates unique signals for firms and regulators.
EU ETS and UK ETS: alignment, divergence, and EUA pricing dynamics
The european union’s ETS remains the largest by value and a global price benchmark. Its auction cadence and market design drive allowance liquidity and long-term expectations.
The UK launched an independent ETS in 2021. Designs share DNA, but governance differences have produced divergent EUA and UKA prices paths and trading patterns.
China’s power-sector ETS and expected sectoral expansion
China’s system started in 2021 and covers roughly 40% of national emissions through the power sector. Authorities plan phased expansion to steel, cement, and other heavy industries.
That expansion will reshape regional supply-demand dynamics and create larger cross-border hedging needs for firms exposed to Asian markets.
K-ETS, NZ ETS, and Australia’s ACCUs: coverage and policy evolution
South Korea’s K-ETS (2015) now covers about 75% of S1+S2 emissions and is in a liquidity-building phase.
New Zealand’s scheme covers more than half the national total; agricultural treatment remains an open policy frontier under review.
Australia relies on ACCUs as domestic offset-like units, with a cost-containment cap rising to AUD $75/tonne (CPI+2). These rules influence corporate hedging, procurement timing, and exposure across both allowances and offsets.
Voluntary carbon market and standardized contracts
A new set of futures—segmented by supply type and verification—lets buyers hedge quality risk ahead of delivery.
N-GEO: nature-based baskets
N-GEO packs verified AFOLU credits (Verra) into a tradable instrument. It aggregates forest and land‑use supply to smooth price swings and capture co‑benefits; buyers get bundled nature exposure with predictable forward quantities.
GEO: CORSIA-aligned aviation units
GEO mirrors ICAO CORSIA rules and draws from Verra, ACR, and CAR. That alignment tightens eligibility and raises baselines for aviation-grade integrity; it helps airlines meet offsets for international emissions while improving market trust.
C-GEO and Core Carbon Principles
C-GEO focuses on tech-based, non-AFOLU units that meet the Integrity Council’s CCPs. The CCPs set a quality floor—MRV rigor, permanence, governance—and narrow seller pools; the result is clearer pricing for high-integrity credits.
Contract
Supply Type
Key Benefit
N-GEO
Nature-based (Verra)
Co-benefits; cheaper forward supply
GEO
CORSIA-eligible (Verra/ACR/CAR)
Aviation-grade acceptance; tighter eligibility
C-GEO
Tech removals (CCP-aligned)
Higher integrity; lower permanence risk
Practical advice: blend N-GEO, GEO, and C-GEO to balance cost, quality, and forward certainty; use futures for trading and hedging. Note that some compliance regimes may recognize limited voluntary units under strict rules.
Projects and supply: renewable energy, nature-based solutions, and REDD+
Patterns of supply now show dominant renewable energy output alongside a surging nature-based pipeline.
Renewable energy projects accounted for roughly 55% of issued units in 2022 and about 52% of retirements; wind and solar led issuance while falling technology costs reduced additionality concerns for large installations.
That decline in cost suggests issuance from new renewable energy schemes may taper as grid parity widens; buyers should expect shifting supply mixes over multi-year horizons.
Nature-based supply and REDD+
Nature-based solutions made up about 54% of new registrations in 2022, driven by biodiversity and livelihoods co-benefits; avoided deforestation (REDD+) and improved forest management remain core AFOLU sources.
REDD+ design focuses on avoided loss, leakage controls, and permanence buffers to manage long-term risk.
Latin America—Brazil, Colombia, Chile—updated forestry rules in 2023, expanding pipelines and governance.
Risks persist: baseline integrity, permanence, and social safeguards determine investability and unit performance over time.
Buyer advice: match geography and methodology to claimed outcomes (avoided emissions vs removals); prefer blended portfolios and multi-year contracts to hedge supply and quality risk.
Renewable Energy Credits (RECs) and SRECs: how they work and how to buy
Renewable energy certificates certify one megawatt-hour of clean generation; they capture the attribute of green power, not the physical electron. Think of a serial-numbered proof of production.
The issuance process includes a unique registry serial, a generation timestamp, and a formal retirement step to prevent double counting. These tracked credits let buyers claim renewable energy use while grids mix electrons.
Procurement pathways
Unbundled certificates deliver speed and flexibility; they are lowest-friction for offsetting consumption.
PPAs provide additionality and long-term price certainty for a larger renewable energy project.
Utility green tariffs and green pricing are simple on-ramps for organizations that prefer a managed offering.
On-site self-generation produces SRECs or surplus certificates that can offset local loads or be sold into the market.
Prices and policy basics
SRECs—solar-specific certificates—vary widely by state, often ranging from about $10 to $400; some wind certificates trade as low as $1–$8. The U.S. federal solar investment tax credit (ITC) is 30% for systems installed through 2032, which affects payback and overall cost.
Practical buyer advice
Match vintage and geography to program rules and distribute purchases across sites for proportional coverage. For compliance users, ensure certificate attributes meet local requirements and that retirement is verifiable to avoid claims that conflict with emissions accounting.
RECs vs carbon credits: different instruments, different impacts
RECs and carbon credits play distinct roles in corporate climate strategy. One documents renewable electricity attributes in kWh; the other represents a tonne of avoided or removed CO2e.
Offsetting electricity (kWh) versus GHG mitigation (tCO2e)
Market-based Scope 2 accounting recognizes renewable energy certificates for electricity use. That helps firms claim green energy consumption without changing grid flows.
By contrast, a carbon credit quantifies a reduction or removal of carbon emissions. Those units address Scope 1 or Scope 3 exposures where allowed.
Accounting: use market-based certificates for electricity; apply high-quality offsets for residual emissions.
Integrity: disclose boundaries, vintage, and methodology to avoid double claims.
Combine efficiency, on-site renewable energy, and then select verified credits for remaining emissions. Over-reliance on unbundled certificates can look cosmetic and risk reputation. A balanced portfolio gives both energy claims and real emissions results.
ESC and performance-based approaches: EPS, OBPS, and sector benchmarks
Where full economy-wide charges stall, performance approaches offer a pragmatic path for hard-to-abate industries. Canada’s OBPS taxes emissions above output-based benchmarks; the UK operates an EPS model; several U.S. states use similar standards.
How they work: intensity targets tie allowable pollution to production output. Facilities that beat the benchmark can earn tradable compliance units; those that lag must pay or purchase units to meet obligations.
Policy position: hybrids fill gaps where full caps or levies face political or administrative hurdles; they also reduce leakage risk for trade-exposed firms. Benchmarks often sit alongside an ets or free allocation, shaping who gets credits and who pays.
Design note: benchmarks reward intensity improvements rather than absolute cuts.
Market interaction: over-performance creates supply of compliance units that trade in secondary markets.
Industry advice: audit baselines, plan capital upgrades, and register performance early to monetize gains where allowed.
For companies, the practical step is simple: measure ghg and output carefully, test upgrades against benchmarks, and treat these systems as another compliance channel in carbon risk planning.
Carbon storage and removals in markets: from nature to tech
Not all removals are created equal; the market is learning to pay a premium for permanence. Nature-based options (afforestation, reforestation, improved forest management) supply broad volumes, while engineered solutions (DACCS, mineralization) deliver durability at higher cost.
Nature-based versus tech-based crediting
Removals remove CO2 from the atmosphere; avoided emissions prevent further releases. Markets now price that difference—true removals command higher rates because they reduce legacy concentration.
Permanence and risk differ sharply. Tech-based removals tend to offer stronger durability; nature-based supply needs buffers, monitoring, and active stewardship to manage reversal risk.
Procurement tip: match a carbon offset type to your claim—removal vs reduction—and budget limits.
Standards matter: CCPs and CORSIA-style rules push clearer disclosure and better MRV.
Buyers should blend units: use nature for volume and tech removals to meet permanence needs and reputation goals.
Measuring your carbon footprint and using credits/RECs credibly
Accurate measurement and clear rules turn good intentions into credible climate claims. Start by defining boundaries for Scope 1, Scope 2 (location vs market-based), and Scope 3 so inventories reflect actual operational exposure.
Scopes, market-based accounting, and avoiding double counting
Market-based Scope 2 accounting recognizes renewable certificates; standardized registries use serial numbers and retirements to prevent duplicate claims. Voluntary retirement reached roughly 196 million units in 2022, showing market maturation.
Document contracts, attestations, and registry retirements clearly; auditors expect traceable records. This practice reduces reputational risk and improves compliance readiness.
Integrating efficiency, renewables, and high-quality offsets
Follow a hierarchy: improve efficiency first, then buy renewables through PPAs or on-site systems (the U.S. solar ITC offers a 30% incentive through 2032), and use high-quality credits only for truly residual emissions.
Practical tip: set an internal carbon price to steer capital and align procurement with expected external signals. Transparent reporting, registry exclusivity, and strong data governance keep claims defensible.
Global Carbon: pricing, taxes, crediting, projects, footprint, REC, ESC, storage
This section ties price signals, coverage regimes, and procurement tools into a compact playbook for decision-makers. It links major program examples—EU ETS at the €100 milestone, the UK ETS after Brexit, China’s power-sector ETS (~40% coverage), K-ETS (~75% of S1+S2), New Zealand’s economy-wide scheme, and Australia’s ACCUs cap (AUD 75, CPI+2)—to practical buying choices.
Key connections to remember:
Compliance and voluntary domains interact; standards like CORSIA and CCPs raise the quality floor for credits.
Procurement playbook: unbundled certificates, SRECs/on-site solar, long-term PPAs, green tariffs, and verified offsets or removals.
VCM instruments (N-GEO, GEO, C-GEO) provide nature, aviation, and tech pathways for forward coverage.
Practical note: U.S. buyers should watch EU, UK, and China price signals as strategic indicators. A blended approach—using renewables for immediate claims and high-integrity credits for residual co2—keeps plans defensible and aligned with evolving market dynamics.
What U.S. buyers should know now: RGGI pathways, PPAs, and procurement strategy
For U.S. procurement teams, the key decision is balancing speed, certainty, and reputation when buying renewable energy and complementary credits. This choice affects exposure to allowance costs, wholesale prices, and compliance risk.
Choosing between unbundled certificates, on-site solar, and long-term PPAs
Unbundled certificates are fast and flexible; they suit near-term claims and short windows (21 months for some programs). On-site solar gives operational value and pairs with the 30% federal solar tax credit through 2032.
Long-term PPAs (10–20 years) add additionality and hedge against volatile wholesale prices; they also help finance large energy projects.
Option
Speed
Additionality / Hedge
Typical Tenor
Unbundled certificates
Fast
Low additionality
Short (0–3 yrs)
On-site solar
Medium
Operational value; ITC benefit
Asset life (20+ yrs)
Long-term PPA
Slow
High; price hedge
10–20 yrs
Applying CORSIA-grade and nature-based credits in U.S. portfolios
Use GEO (CORSIA-grade) and N-GEO/C-GEO blends to cover residual emissions. Carbon credits that meet CCP standards improve quality signals and reduce reputational risk.
Note RGGI auctions can push allowance costs into retail rates; buyers should model that exposure and consider incentive programs, SREC variability by state, and PPA tenor when planning trade-offs.
Outlook to 2030: scaling prices, coverage, and integrity
Expect stronger financial nudges over the next decade as regulators tighten limits and extend coverage into new sectors.
World Bank scenarios point to a $50–$100/tCO2 band by 2030 to align with temperature goals. Today, fewer than 5% of global emissions face that signal; roughly 73 instruments cover about 23% of emissions.
That gap means policy design will determine whether prices actually climb or merely ping regional markets. Key levers include tighter caps, reduced free allocation, escalator fees, and sector expansion into heavy industry and transport.
Implications for markets and supply
Expect three shifts: wider systems coverage, higher per‑ton values, and stronger integrity rules. The EU ETS milestones show how rapid tightening can lift market signals.
Coverage: more jurisdictions will add or link trading systems and hybrid benchmarks.
Integrity: CCPs and CORSIA-style norms will raise baselines, permanence, and transparency.
Supply: AFOLU pipelines will mature while tech removals win a price premium for durability.
For U.S. buyers the practical steps are clear: set an internal price, lock long-term PPAs where possible, and pre-position for higher-quality offset supply to manage exposure and reputational risk.
Conclusion
Totalconclusionof carbon and climate context
Policy signals, rising receipts, and stronger standards have nudged the market toward maturity; 2022 revenues neared USD 100 billion while voluntary retirements reached roughly 196 million units.
Coverage remains uneven: about 73 instruments now touch ~23% of global emissions, and fewer than 5% of emissions face the $50–$100 per‑ton band. Nature-based registrations supplied roughly 54% of new supply in recent years.
The practical playbook is unchanged: cut energy use first; deploy renewables and long-term contracts; then buy high-quality credits for residual emissions. Internal pricing, clear governance, and transparent claims will matter as signals tighten.
Integrity and scale must advance together; only that tandem will deliver durable change across the world in the coming years.
Key Takeaways
2022 revenues reached record levels while price exposure remains uneven across regions.
Direct pricing (tax/ETS), performance standards, and voluntary credits play different roles.
Renewable credits dominate supply; nature-based and tech removals are expanding.
U.S. options include RGGI pathways, SREC variability, and the 30% solar ITC.
Only a small share of emissions face near-$50–$100 prices today; scale and integrity are urgent for 2030.
This website is saving the energy of your screen as it is not being used. It's part of a global effort to lower the planet's electrical consumption and CO2 emission level. Resume browsing