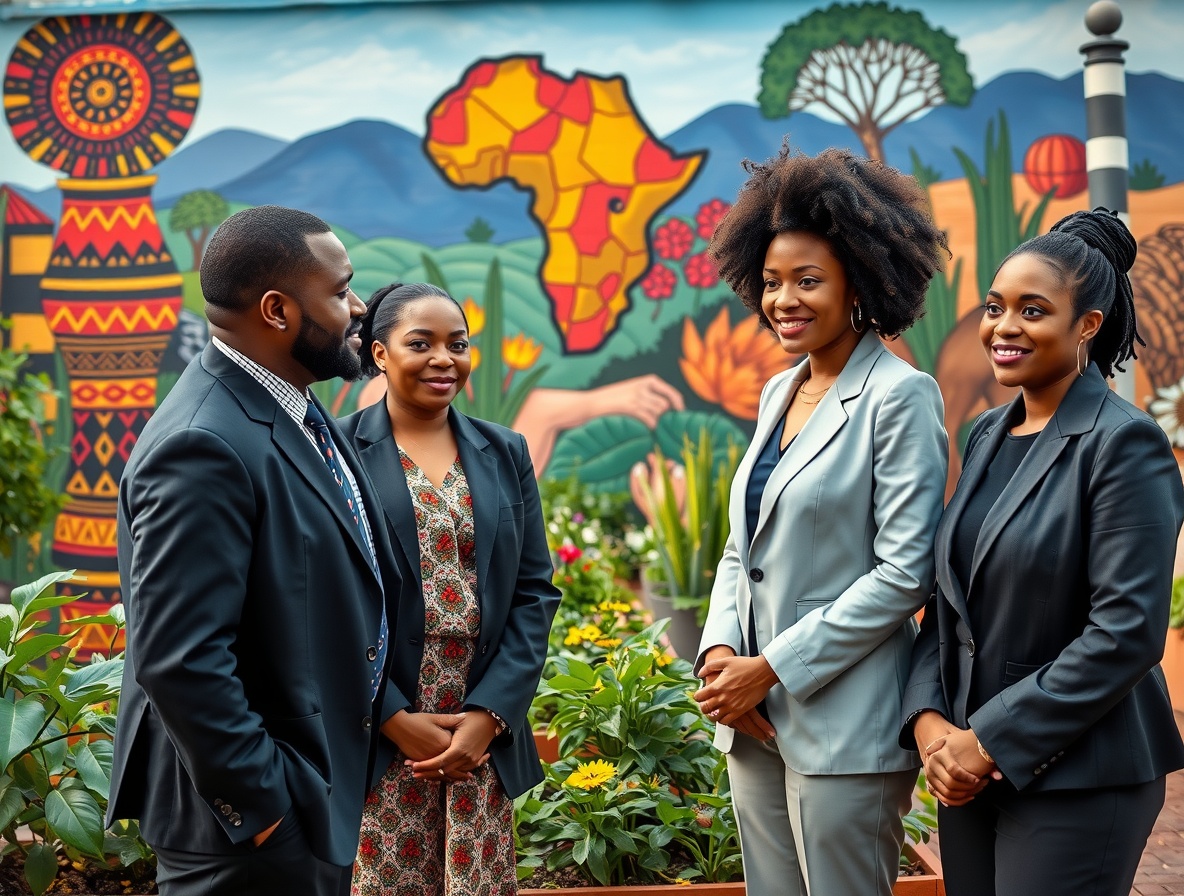
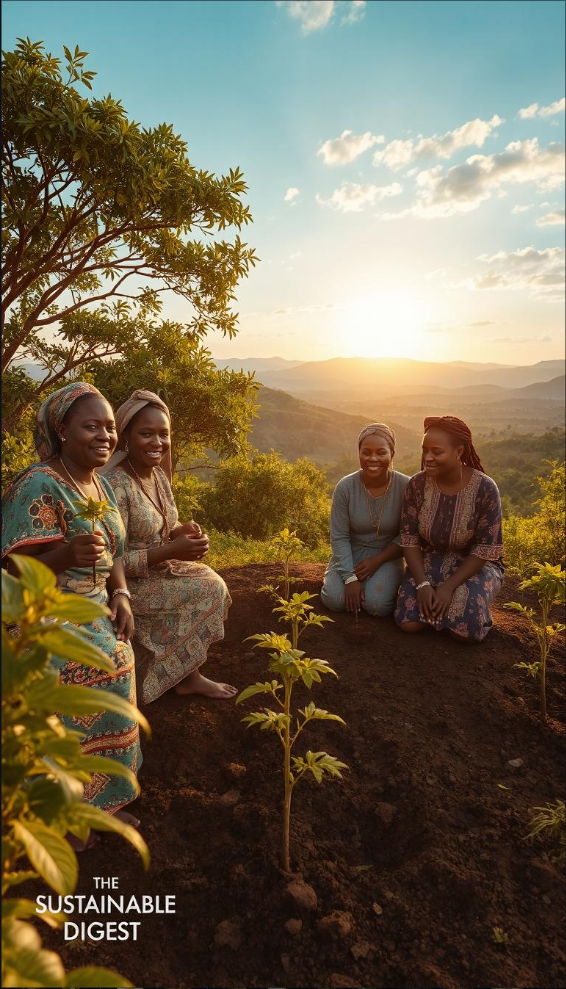
2025 Earth Overshoot Day National Marine Week Doughnut Economics Buen Vivir SDGs

2025 Earth Overshoot Day National Marine Week Doughnut Economics Buen Vivir SDGs

Every year, humanity reaches a critical milestone—the point where our resource consumption exceeds what the planet can regenerate. This moment, calculated by the Global Footprint Network, serves as a stark reminder of ecological imbalance. In 2025, this date falls earlier than ever, signaling urgent action is needed.

The gap between demand and supply varies globally. Some nations exhaust their share by February, while others stretch resources until December. This disparity highlights both challenges and opportunities for sustainable solutions.

Balancing economic growth with environmental limits requires innovative thinking. Alternative models and conservation efforts, like those during National Marine Week, offer pathways forward. Aligning with global goals could theoretically delay this milestone by weeks—if systemic changes are implemented.

Understanding Earth Overshoot Day 2025: A Global Ecological Alarm

Resource depletion rates now outpace nature’s ability to recover. The Global Footprint Network tracks this imbalance, calculating when humanity exhausts its annual ecological budget. In 2025, the deficit deepens—148 days of “overspend” loom ahead.

What This Milestone Measures

The date marks when demand for resources surpasses what ecosystems can regenerate. It’s like maxing out a credit card but with forests, fisheries, and carbon sinks. The Footprint Network crunches 15,000+ data points across 200 nations to pinpoint this moment.

Country-Specific Trends: Feast or Famine?

Disparities are stark. The U.S. hits its limit by March 13—three months earlier than the global average. Meanwhile, Vietnam stretches resources until July. Below, extremes from the 2025 data:

CountryOvershoot DateChange from 2024
QatarFebruary 6
LuxembourgFebruary 17–1 day
Dominican RepublicDecember 28–52 days
ArmeniaJune 10+11 days

The U.S. Reality Check

Americans consume five times more resources per capita than the global average. Despite minor improvements (–1 day from 2024), systemic shifts—like the Netherlands’ –32 day drop through wind energy—remain rare. The pandemic’s 2020 “delay” (24 days) proved temporary; rebound effects erased gains by 2023.

This isn’t just about dates—it’s about redefining progress. When Armenia’s footprint grows amid economic decline, or Mongolia cuts 10 days through policy, the data demands smarter solutions.

National Marine Week and the Fight Against Ecological Deficit

A serene underwater scene showcasing the vibrant marine ecosystems and their vital role in carbon absorption. In the foreground, schools of tropical fish dart among vibrant coral reefs, their colorful fins reflecting the warm, golden sunlight filtering down from the surface. In the middle ground, kelp forests sway gently, their fronds undulating in the current. In the background, a breathtaking vista of the ocean floor, dotted with anemones, sponges, and other diverse marine life. The image is captured with a wide-angle lens, conveying a sense of scale and the interconnectedness of this delicate, life-sustaining ecosystem. Commissioned by The Sustainable Digest.

The ocean silently shoulders humanity’s ecological debt, absorbing what land cannot. Marine systems provide half the planet’s oxygen and capture 30% of carbon emissions—yet their decline accelerates the earth overshoot timeline. Protecting these natural resources isn’t optional; it’s arithmetic for survival.

Marine Ecosystems as Carbon Sinks and Resource Regenerators

Mangroves and seagrasses store four times more carbon than rainforests per hectare—a fact overshadowed by deforestation debates. Indonesia’s November 18 overshoot date links directly to coral reef loss; healthy reefs could delay global deficit by 18 days. Meanwhile, Iceland’s +3-day improvement proves sustainable fishing’s impact.

“The sea, the great unifier, is man’s only hope. Now, as never before, the old phrase has a literal meaning: we are all in the same boat.”

Jacques Cousteau

How Overfishing and Pollution Accelerate Overshoot

Japan’s tuna depletion worsens its deficit by 5 days, while Spain’s May 23 milestone reflects Mediterranean microplastics choking ecosystems. Annual plastic waste (8M tons) equals dumping a garbage truck into the sea every minute. The solution? Scale innovations like 40M km² seaweed farms—marine permaculture that regenerates natural resources.

  • Blue carbon potential: Coastal wetlands offset emissions equal to 1.5 billion cars.
  • Funding gap: SDG 14 needs $35B/year to reverse biodiversity loss by 2030.

Doughnut Economics and Buen Vivir: Alternative Frameworks for Balance

Traditional economic models are cracking under ecological pressure, revealing the need for radical redesign. As the *global footprint* expands, two frameworks—one modern, one ancient—offer blueprints to recalibrate human progress within planetary limits.

Balancing Human Needs and Planetary Boundaries

Oxford economist Kate Raworth’s Doughnut Model visualizes a safe space between 9 ecological ceilings and 12 social foundations. Currently, four boundaries are breached: climate, biosphere integrity, land use, and biochemical flows. Amsterdam’s 2020 adoption slashed its overshoot impact by 14%, proving cities can thrive within the “doughnut’s” ring.

The model flips *economic growth* dogma. It prioritizes regenerative systems over extraction—like Barcelona’s circular economy parks, which repurpose 85% of urban waste. Raworth’s critique? *”20th-century economics in space-age packaging”* fails to account for nature’s ledger.

Indigenous Wisdom for Sustainable Living

Ecuador’s 2008 constitution enshrined *Buen Vivir* (“good living”), an Andean philosophy valuing harmony over GDP. Bolivia’s July 12 overshoot date (-2 days vs. 2024) reflects its *resource*-light traditions: *chacra* farms boast 300% more biodiversity than monocultures.

  • Gross Ecosystem Product: China’s alternative metric values Tibet’s wetlands at $1.1 trillion—triple its GDP.
  • Global impact: Scaling *Buen Vivir* could add 42 overshoot days by aligning consumption with ecological rhythms.

“We don’t inherit the earth from our ancestors; we borrow it from our children.”

Native American Proverb

These frameworks share a truth: *sustainable living* isn’t austerity—it’s smarter design. From Amsterdam’s canals to Andean terraces, *change* begins where growth meets balance.

The Role of SDGs in Delaying Earth Overshoot Day

A vibrant, photorealistic landscape depicting the intersection of the Sustainable Development Goals (SDGs) and circular economy solutions. In the foreground, a diverse array of sustainable technology and practices are showcased, including solar panels, wind turbines, water purification systems, and recycling facilities. The middle ground features a bustling urban environment with green spaces, electric vehicles, and people engaged in sustainable living. In the background, a serene natural setting with lush forests, clean waterways, and thriving wildlife symbolizes the harmony between human progress and environmental preservation. The scene is illuminated by warm, directional lighting, captured through a wide-angle lens to emphasize the scale and interconnectedness of these elements. The overall mood is one of optimism, innovation, and a commitment to a sustainable future, as represented by the subtle branding of "The Sustainable Digest" in the lower corner.

Waste is no longer an endpoint—it’s the raw material for systemic change. The SDGs provide a blueprint to transform linear economies into regenerative loops. When paired with corporate actions and policy levers, these goals could delay ecological deficit by months, not minutes.

SDG 12 and 14: The Dynamic Duo

Responsible consumption (SDG 12) and marine conservation (SDG 14) share a symbiotic relationship. Combined, they offer 23% potential overshoot reduction by 2030. Kamikatsu, Japan, proves this works—its 80% recycling rate dwarfs the national 20% average.

Reconomy’s circular economy solutions delayed overshoot by 12 minutes in 2024. Small? Maybe. Scalable? Absolutely. Patagonia’s Worn Wear program cuts garment CO2 by 73%, turning used gear into revenue streams.

From Boardrooms to Billions

Tech is accelerating the shift. AI-driven logistics slash retail waste by 31%, while the EU’s 2026 Digital Product Passport will trace supply chains like a sustainability Fitbit. The ROI? 14% cost savings for businesses adopting circular models.

“Legislation isn’t just red tape—it’s the new green tape.”

Anonymous Policy Analyst

Thirty-eight nations now enforce Extended Producer Responsibility (EPR) laws, mandating companies to manage product lifecycles. Below, a snapshot of 2025’s trailblazers:

CountryEPR Law ScopeImpact
GermanyPackaging, electronics72% recycling rate
South KoreaFood waste, textiles–3 overshoot days
CanadaPlastics, batteries$1.2B saved annually

The next frontier? Overshoot Impact Bonds—financial instruments tying returns to footprint reduction. Because when the planet wins, portfolios shouldn’t lose.

Conclusion: Pathways to a Regenerative Future

A regenerative future isn’t a utopian dream—it’s a mathematical necessity. Combined measures, from policy shifts to circular economy adoption, could slash the ecological deficit by 72 days. The new “Overshoot Coefficient” metric quantifies progress, turning abstract goals into actionable data.

Linear models are bankrupting nature; circular systems unlock a $4.5 trillion opportunity. Imagine carbon markets trading overshoot days like commodities—a futures market for the sustainable future. As one analyst quipped, “Humanity’s ecological spreadsheet needs pivot tables.”

The antidote? Not less civilization, but better-designed systems. A 3% annual shift in consumption patterns could balance the ledger by 2050. The choice is clear: innovate or overspend.

FAQ

What does Earth Overshoot Day represent?

It marks the date when humanity’s demand for ecological resources exceeds what the planet can regenerate in a year. The Global Footprint Network calculates this by comparing biocapacity and consumption patterns.

How does National Marine Week connect to ecological balance?

Oceans absorb carbon and sustain biodiversity, acting as critical buffers against overshoot. Protecting marine health through sustainable practices helps delay resource depletion.

What is Doughnut Economics?

A model developed by Kate Raworth that balances human well-being within planetary boundaries. It prioritizes regenerative systems over unchecked growth, aligning with sustainability goals.

How does Buen Vivir differ from Western economic models?

Rooted in Indigenous Andean philosophy, Buen Vivir emphasizes harmony with nature over GDP growth. It advocates for community-centric resource management and cultural preservation.

Which SDGs directly impact overshoot timelines?

SDG 12 (responsible consumption) and SDG 14 (marine conservation) are pivotal. Reducing waste and protecting oceans can significantly lower humanity’s ecological footprint.

Why do some countries overshoot earlier than others?

High-income nations often exhaust resources faster due to intensive consumption. The U.S., for example, hits its overshoot date by March, while others align closer to the global average.

Key Takeaways

  • Humanity currently uses resources equivalent to 1.7 Earths annually.
  • The overshoot date has moved up by over five months since 1971.
  • Countries experience this imbalance at vastly different times.
  • Conservation initiatives can help shift the timeline.
  • Systemic changes are crucial for long-term sustainability.

International Cooperative Alliance (ICA) 2024 Annual Report 2025 Analysis: Key Insights into Sustainable Development

International Cooperative Alliance Annual Report 2024 analysis and reflections

The ICA Annual Report 2024 offers a comprehensive overview of the global cooperative movement’s progress toward sustainable development. Cooperatives worldwide are demonstrating significant growth and resilience, contributing substantially to achieving the United Nations’ Sustainable Development Goals.

The report highlights the data-driven achievements of cooperatives across various sectors, showcasing their role in promoting economic resilience and social inclusion. With a focus on sustainable development, the report provides insights into how cooperatives are addressing global challenges.

The Global Cooperative Landscape in 2024

As we navigate 2024, the world’s cooperatives are presenting a diverse and dynamic landscape, shaped by various geographical and economic factors. The cooperative movement continues to play a vital role in the global economy, with a significant presence in multiple regions.

Key Statistics and Growth Trends

The global cooperative landscape is characterized by robust growth trends, with cooperatives demonstrating resilience in the face of economic challenges. Key statistics highlight the sector’s strength, including an increasing number of world members and a rising turnover among top cooperatives.

“Cooperatives are member-owned businesses that operate for the benefit of their members, providing essential services and support to local communities,” as emphasized in the International Cooperative Alliance’s reports. This member-centric approach has contributed to the sector’s stability and growth.

Geographic Distribution of Cooperatives

The geographical distribution of cooperatives reveals a diverse landscape, with various regions hosting significant numbers of cooperative enterprises. Europe continues to host the highest concentration of large cooperatives, with 45% of the Top 300 enterprises headquartered in the region, particularly in France, Italy, Germany, and Spain.

  • North America accounts for 27% of the world’s largest cooperatives, with significant clusters in agricultural and financial service sectors.
  • The Asia Pacific region shows the most dynamic growth, increasing its representation in the Top 300 from 18% to 22% since 2020, with Japan, South Korea, and Australia leading this expansion.
  • Africa’s cooperative sector demonstrates promising development, with 15 enterprises now ranking among the global Top 300, primarily in agricultural and financial services.

International Cooperative Alliance Annual Report 2024 Analysis and Reflections

A vibrant landscape showcasing the diverse nature of cooperatives, set against a backdrop of rolling hills and a warm, golden sky. In the foreground, a bustling farmer's market teeming with an array of locally-sourced produce, artisanal goods, and people engaged in lively exchanges. The middle ground features a modern, energy-efficient cooperative housing complex, its sleek, eco-friendly design in harmony with the natural surroundings. In the distance, a wind farm stands tall, its spinning turbines a symbol of the cooperative's commitment to renewable energy and sustainability. The overall scene exudes a sense of community, empowerment, and a shared vision for a more sustainable future, as captured by "The Sustainable Digest".

The 2024 Annual Report by the International Cooperative Alliance sheds new light on the global cooperative movement, offering insights into the current state and future prospects of cooperatives.

Methodology and Data Collection Process

The World Cooperative Monitor project collects data from large cooperative enterprises and aggregations of cooperatives worldwide. Data collection involves online research, financial statements, and annual reports integrated with national/regional datasets. This comprehensive approach enables a thorough understanding of the cooperative landscape.

Major Findings and Highlights

The report reveals several key findings that highlight the resilience and adaptability of cooperatives. Some of the major highlights include:

  • Cooperatives with strong democratic governance structures demonstrated 23% higher resilience during economic volatility.
  • A significant 78% of cooperatives have implemented substantial digital transformation initiatives.
  • Environmental sustainability is a growing focus, with 82% of surveyed cooperatives having formal climate action plans, a 15% increase from 2023.
  • Financial data shows that cooperatives maintain stronger capital reserves than comparable conventional businesses.
  • A correlation exists between cooperative density in a region and higher social cohesion metrics, indicating broader community benefits.

These findings underscore the impact of cooperatives on both local economies and the environment, reinforcing the value of the cooperative model in achieving sustainable development goals.

Economic Performance of Top Cooperatives

The economic performance of top cooperatives is a crucial indicator of their overall health and contribution to the global economy. Cooperatives have demonstrated significant economic resilience and impact across various sectors.

Top 300 Cooperatives by Turnover

The ranking of the Top 300 cooperatives by turnover highlights the dominance of certain sectors and the financial prowess of these enterprises. Agricultural cooperatives and financial service cooperatives are among the top performers, showcasing their substantial economic influence.

Turnover to GDP Ratio Analysis

The turnover-to-GDP ratio analysis offers a nuanced understanding of the economic impact of cooperatives relative to national economic conditions. Key findings include:

  • Agricultural cooperatives lead this ranking with 103 enterprises in the Top 300, underscoring their economic importance in developing economies.
  • Financial service cooperatives show improved positioning in the turnover-to-GDP ratio ranking, with 45 enterprises in the Top 300.
  • The analysis reveals that cooperatives in emerging economies often have a larger economic footprint relative to their national GDP.

This data provides valuable insights into the economic impact of cooperatives and their role in local economies, highlighting their significance beyond absolute turnover figures.

Sectoral Analysis of Cooperative Performance

A sleek, modern data visualization dashboard showcasing key performance metrics for a diverse array of cooperatives, set against a backdrop of lush, sustainable landscapes. In the foreground, clean infographic panels display insightful sectoral analyses, the data points illustrated with elegant, minimalist icons. The middle ground features a tactile, hand-drawn world map, pinpointing the global reach of the cooperative movement. In the background, a serene panorama of rolling hills, verdant forests, and shimmering bodies of water, captured through the lens of a high-quality, wide-angle camera. The overall mood is one of technological sophistication, environmental consciousness, and a commitment to the cooperative principles of self-help, self-responsibility, democracy, equality, equity, and solidarity. Branding for "The Sustainable Digest" is subtly incorporated into the design.

The International Cooperative Alliance Annual Report 2024 provides a comprehensive sectoral analysis of cooperative performance across various industries. This analysis highlights the strengths and challenges faced by cooperatives in different sectors.

Insurance and Financial Services

Cooperatives in the insurance and financial services sector have demonstrated resilience and adaptability. They have maintained strong member engagement and implemented innovative financial products. The report notes that these cooperatives have a significant impact on the global financial landscape.

Agricultural Cooperatives

Agricultural cooperatives faced significant challenges, particularly during the COVID-19 pandemic. For instance, in Japan, the sudden drop in demand for school meals led to stockpiled inventory for milk producers. However, these cooperatives have shown resilience by adapting to new market conditions and finding alternative demand channels. Agricultural cooperatives play a crucial role in supporting farmers and rural communities.

Retail and Consumer Cooperatives

Retail and consumer cooperatives have shown strong growth, with combined revenues increasing by 7.8%. They have outperformed conventional retail by 2.3 percentage points. Key strengths include high member engagement, with an average active membership rate of 76%. The sector is also leading in sustainable supply chain management, with 83% of large consumer cooperatives implementing comprehensive ethical sourcing policies.

SectorGrowth RateMember Engagement
Retail and Consumer Cooperatives7.8%76%
Agricultural CooperativesN/AHigh
Insurance and Financial ServicesN/AStrong

The report highlights the digital transformation in retail cooperatives, with 91% now offering integrated online shopping platforms. This has resulted in a 34% increase in digital sales channels. Furthermore, consumer cooperatives are pioneering circular economy initiatives, with 64% implementing packaging reduction programs and 58% developing product take-back schemes.

Financial Stability and Capital Structure

Financial stability is a hallmark of cooperatives, thanks to their distinct capital structure and operational model. This stability is rooted in their unique approach to financial management, which prioritizes member value over external investor interests.

Debunking the Undercapitalization Myth

The notion that cooperatives are undercapitalized is a misconception. In reality, they often generate resources internally, making them more financially sound than traditional corporations. Data shows that cooperatives maintain lower leverage ratios, averaging 2.1 compared to 3.4 for conventional businesses, providing greater resilience during credit market disruptions.

Investment Patterns and Resource Generation

Large cooperatives demonstrate distinctive investment patterns, with 73% of capital expenditures funded through internally generated resources. The report highlights a trend toward increased research and development investment, with $78 billion allocated to innovation initiatives in 2023. Member capital contributions remain significant, with $32 billion raised through member shares and certificates, underscoring the strength of the cooperative funding model, which benefits its members.

Cooperative Resilience Post-Pandemic

A vibrant landscape of cooperative resilience post-pandemic. In the foreground, a group of diverse individuals stand hand-in-hand, their faces radiating determination and unity. The middle ground showcases thriving community gardens, renewable energy installations, and shared workspaces - symbols of the cooperative's commitment to sustainable development. In the background, a cityscape rises, its skyline dotted with innovative cooperative housing and social enterprises, all bearing the logo of "The Sustainable Digest". Warm, natural lighting illuminates the scene, casting a hopeful glow and conveying a sense of optimism and collective strength.

The pandemic era tested the resilience of cooperatives globally, pushing them to adapt to unprecedented challenges. Cooperatives had to navigate the complexities of maintaining operational continuity while ensuring the health and safety of their members and stakeholders.

Recovery Strategies Implemented

Cooperatives implemented various recovery strategies to mitigate the impact of the pandemic. A significant number accelerated their technology adoption plans, with 92% recognizing the importance of digital infrastructure for resilience. As stated in the report, “cooperatives with strong digital infrastructure recovered more quickly.” This strategic shift enabled cooperatives to continue their operations effectively despite social distancing measures.

The importance of member engagement was also highlighted, as democratic decision-making processes facilitated consensus around difficult adaptation measures. Cooperatives that maintained higher equity ratios demonstrated greater resilience, underscoring the value of financial reserves.

Lessons Learned from COVID-19 Crisis

The COVID-19 crisis taught cooperatives valuable lessons about resilience and adaptability. Diversification emerged as a key factor, with multi-stakeholder cooperatives showing 27% less revenue volatility. The crisis also accelerated innovation, with 63% of cooperatives developing new products or services in response to pandemic-related needs. As one cooperative leader noted, “The pandemic forced us to rethink our business model and innovate for the future.” Cooperatives that work closely with their members and adapt to challenges are better positioned to overcome future crises.

The experience of cooperatives during the pandemic highlights the importance of resilience and the need for continued innovation and adaptation in the face of challenges.

Cooperatives and Sustainable Development Goals

Cooperatives play a vital role in achieving the Sustainable Development Goals (SDGs) through various initiatives. They act on multiple fronts, including gender equity, combating economic inequalities, and implementing more sustainable models of production and consumption.

Alignment with the 2030 Agenda

The 2024 report by the International Cooperative Alliance underscores the alignment of cooperatives with the 2030 Agenda for Sustainable Development. Cooperatives have demonstrated their ability to support local communities through their robust social networks, promoting collective risk perception and new strategies to address challenges. 73% of cooperatives implement initiatives that advance multiple SDGs simultaneously, showcasing their effectiveness in addressing interconnected sustainability goals.

Measuring SDG Contributions

The report introduces a standardized framework for measuring cooperative contributions to the SDGs, enhancing impact reporting across the sector. Refined data collection methodologies capture both direct impacts, such as emissions reductions, and indirect contributions, like community capacity building. For instance, cooperatives collectively reduced carbon emissions by 187 million tons in 2023 through renewable energy adoption and sustainable practices.

SDG AreaCooperative InitiativesImpact
Renewable EnergyAdoption of solar and wind energyReduction in carbon emissions
Sustainable AgriculturePromotion of organic farming practicesImproved soil health and biodiversity
Community DevelopmentCapacity building and training programsEnhanced community resilience

The data highlights the significant role cooperatives play in achieving the SDGs, emphasizing the need for continued support and development of these organizations to maximize their impact on sustainable development.

Rural Energy Cooperatives: Emerging Models

A rural landscape at golden hour, featuring a cluster of energy cooperatives nestled among rolling hills and lush greenery. In the foreground, a weathered wooden barn with solar panels adorning its roof. Nearby, a small wind turbine spins gently, casting long shadows across the scene. In the middle ground, a group of cooperatives stand tall, their distinctive architecture blending seamlessly with the natural surroundings. The background is dominated by a picturesque mountain range, its peaks bathed in warm, diffused light. The overall mood is one of harmony and sustainability, showcasing "The Sustainable Digest"'s vision for the future of rural energy production.

Rural energy cooperatives are emerging as pivotal models for sustainable energy transitions globally. These cooperatives are not only facilitating the adoption of renewable energy technologies but are also ensuring that the benefits are equitably distributed among community members.

Global Analysis of Rural Energy Initiatives

A recent global study by RMI, in collaboration with the International Cooperative Alliance Asia and Pacific (ICA-AP), highlights the success of rural energy cooperatives. The study found that community-led energy transitions facilitated by cooperatives demonstrate 34% higher adoption rates for renewable technologies compared to top-down approaches. The report also documents innovative ownership models that ensure sustainable operations and equitable distribution of benefits.

Community-Led Energy Transitions

Community-led energy transitions are achieving significant energy efficiency outcomes. Participating households have reduced their energy consumption by an average of 12% through behavioral changes and improved management. The analysis identifies key success factors, including accessible financing mechanisms, supportive policy frameworks, and technical capacity building programs. These factors are crucial for the success and scalability of rural energy cooperatives.

Digital Transformation in Cooperatives

The COVID-19 pandemic has accelerated the adoption of digital tools in cooperatives, changing how they interact with members. As cooperatives navigate this new landscape, they are finding innovative ways to balance digital convenience with traditional engagement methods.

Technology Adoption Trends

Cooperatives are increasingly adopting digital technologies to enhance member participation. Key trends include:

  • 76% of cooperatives are implementing multi-channel participation strategies.
  • Online voting and virtual general assemblies have increased member participation rates by an average of 34%.
  • 82% of cooperatives are preserving or expanding local offices and service points, maintaining a strong physical presence in communities.

Balancing Digital and Traditional Member Engagement

As cooperatives adopt digital tools, they are also focusing on creating a seamless integration between digital and traditional engagement channels. This includes:

  • 68% of cooperatives implementing unified member experience strategies.
  • Developing targeted approaches to meet diverse members‘ expectations across different demographic segments.

Governance and Democratic Member Control

The International Cooperative Alliance’s (ICA) Annual Report 2024 highlights significant developments in governance and democratic member control across the cooperative sector. Cooperatives are continually adapting their governance models to meet the evolving needs of their members.

Evolving Governance Models

Innovative governance models are emerging, with cooperatives adopting new approaches to deepen member engagement. 81% of cooperatives are implementing new strategies to enhance participation beyond traditional general assemblies.

Member Participation Strategies

Cooperatives are leveraging digital platforms to facilitate continuous member input, with 63% maintaining year-round consultation mechanisms. Education is also critical, with cooperatives investing $4.2 billion in member education programs focused on cooperative principles and governance.

  • Participatory budgeting and strategic planning are becoming more prevalent, with 47% of cooperatives involving members in major resource allocation decisions.
  • The analysis reveals a correlation between participation rates and member loyalty, with cooperatives achieving high engagement levels reporting 24% lower member turnover.

Climate Action and Environmental Sustainability

A bustling community of energy-efficient cooperatives, their sleek solar panels gleaming in the warm afternoon sun. In the foreground, a group of diverse residents gather, discussing sustainable solutions over cups of locally-sourced tea. The middle ground showcases a modern, eco-friendly apartment complex, its façade adorned with lush, verdant greenery. In the background, a cityscape of towering wind turbines and hydro-electric dams, all working in harmony to power "The Sustainable Digest" - a thriving, self-sufficient community. The scene is bathed in a soft, golden light, conveying a sense of optimism and environmental harmony.

As the world grapples with climate change, cooperatives are emerging as key players in the transition to a more sustainable future. The International Cooperative Alliance Annual Report 2024 highlights significant strides made by cooperatives in reducing their environmental impact.

Carbon Footprint Reduction Initiatives

Cooperatives are actively working to minimize their carbon footprint through various initiatives. Data shows that cooperatives are achieving energy efficiency improvements averaging 3.2% annually, outpacing the general business sector average of 1.8%. The report also notes that cooperatives in energy-intensive sectors are developing sector-specific decarbonization roadmaps, with agricultural cooperatives focusing on regenerative practices and manufacturing cooperatives implementing circular economy principles.

Clean Energy Transitions

Clean energy adoption is accelerating across the cooperative sector, with 79% of large cooperatives implementing renewable energy projects and 52% setting 100% renewable energy targets. The report documents $34.2 billion in cooperative investments in renewable energy infrastructure, including both on-site generation and power purchase agreements. Energy cooperatives are pioneering community-based clean energy models, with 1,850 energy cooperatives now operating worldwide, serving over 42 million member-consumers.

CategoryStatisticCooperative Performance
Renewable Energy Adoption79%Large cooperatives implementing renewable energy projects
100% Renewable Energy Targets52%Cooperatives setting ambitious renewable energy targets
Energy Efficiency Improvements3.2%Annual energy efficiency improvements by cooperatives

Social Impact and Community Development

A vibrant community center in a thriving cooperative neighborhood. In the foreground, a group of diverse residents gather around a table, engaged in lively discussion. Warm lighting filters through large windows, casting a welcoming glow. The middle ground features colorful murals adorning the walls, depicting scenes of collaboration and shared prosperity. In the background, a bustling street scene showcases local businesses, their signs proudly displaying "The Sustainable Digest" logo. An atmosphere of inclusivity, empowerment, and collective impact permeates the scene.

Cooperatives are making significant contributions to community development through various social impact initiatives. These efforts are transforming communities worldwide by addressing social and economic needs.

Local Community Investments

Cooperatives are investing in local communities through various programs. For instance, financial cooperatives have provided services to 857 million previously unbanked or underbanked individuals worldwide, significantly enhancing financial inclusion. These investments have a direct impact on the quality of life in these communities.

Social Inclusion Practices

Cooperatives are implementing comprehensive social inclusion strategies. 84% of cooperatives maintain formal policies to ensure accessibility and participation across diverse community segments. Gender equity initiatives have shown significant progress, with women representing 43% of cooperative board members and 47% of senior management positions. Additionally, cooperatives are engaging 12.3 million young people in cooperative activities and governance, fostering a culture of inclusion within communities and contributing to civil society.

Policy Frameworks and Enabling Environments

A vibrant, harmonious scene of international cooperation and policy frameworks. In the foreground, representatives from diverse nations gather around a table, engaged in thoughtful discussion under warm, diffused lighting. The middle ground features a backdrop of modern, sustainable architecture - clean lines, green roofs, and energy-efficient designs. In the distance, a panoramic view of a bustling city skyline, symbolizing the interconnected, global nature of these policy initiatives. An atmosphere of collaboration, innovation, and a shared commitment to sustainable development permeates the frame. Subtle branding for "The Sustainable Digest" can be seen in the background.

The ICA Annual Report 2024 underscores the importance of creating an enabling environment for cooperatives to thrive. Cooperatives operate within a complex regulatory landscape that can either support or hinder their development.

Supportive Policy Developments

Recent years have seen positive developments in policy frameworks that support cooperatives. Some governments have implemented regulations that recognize the unique characteristics of cooperative business models. For instance, specific laws and regulations have been enacted to facilitate the growth of cooperatives in various sectors, including agriculture and finance.

Key supportive policy developments include:

  • Regulatory frameworks that accommodate cooperative business models
  • Tax incentives for cooperatives
  • Programs to enhance cooperative visibility and awareness

Regulatory Challenges

Despite these advancements, cooperatives continue to face significant regulatory challenges. The report highlights that 68% of cooperatives find existing legal frameworks inadequate for their business models. One-size-fits-all regulations often disadvantage cooperatives, particularly in areas like capital formation and governance.

Regulatory ChallengeImpact on Cooperatives
One-size-fits-all regulationsDisadvantages in capital formation and governance
Inconsistent cross-border regulationsBarriers to international growth
Complex digital regulationsDifficulties in data protection and digital financial services

The analysis recommends policy reforms to create a level playing field for cooperatives, including regulatory impact assessments that consider cooperative business models.

Innovation and Future Opportunities

A sleek, modern office space filled with cooperative-themed visuals. In the foreground, a team of diverse professionals collaborating intently around a holographic display table, their faces alight with innovative ideas. In the middle ground, floor-to-ceiling windows offer a panoramic view of a thriving city skyline, symbolizing the global reach of cooperative movements. The background features wall art and sculptures depicting stylized cooperative symbols, conveying a sense of unity and shared purpose. Subtle, warm lighting casts a thoughtful glow, and the atmosphere exudes a spirit of progress and possibility. The logo "The Sustainable Digest" is discreetly integrated into the scene.

The International Cooperative Alliance’s annual report for 2024 highlights significant advancements in innovation and future opportunities for cooperatives worldwide. As the cooperative landscape continues to evolve, new business models and research priorities are emerging.

Emerging Business Models

Cooperatives are exploring new business models that leverage technological advancements and digital infrastructure. The report identifies a significant focus on agricultural technology, with investments in sustainable farming practices and precision agriculture. Digital platforms are being developed to enhance democratic governance, member engagement, and cooperative-to-cooperative collaboration.

Research and Development Priorities

The report highlights that research and development priorities are increasingly focusing on technological innovation, with collective R&D investments reaching $78 billion in 2023. Cooperatives are investing $23.4 billion in sustainable farming practices, precision agriculture, and climate-resilient crop varieties. The analysis also notes the strengthening of cooperative research networks, with 87 university-cooperative partnerships and 23 dedicated research centers advancing the theoretical and practical knowledge base for cooperative development.

Challenges Facing the Cooperative Movement

A bustling urban setting, conveying the challenges facing the cooperative movement. In the foreground, a diverse group of co-op members engaged in a lively discussion, their faces etched with concern. The middle ground showcases a series of cooperative storefronts, their signage partially obscured by bureaucratic red tape. In the background, towering skyscrapers loom, symbolic of the encroaching influence of corporate giants. Warm, golden lighting casts an air of determination, as the co-op members work to overcome the obstacles before them. Lens: 35mm. Angle: low, capturing the scene from street level. The Sustainable Digest.

The cooperative movement is currently facing a multitude of challenges that threaten its stability and growth. As cooperatives work to address these issues, they must navigate complex internal and external factors.

Organizational Challenges Within Cooperatives

Internally, cooperatives face challenges related to governance and member engagement. Effective governance models are crucial for making strategic decisions that benefit the cooperative. Cooperatives work tirelessly to maintain democratic control and member participation, which can be a complex task.

The table below highlights some key internal challenges faced by cooperatives:

ChallengeDescriptionImpact
GovernanceEnsuring effective decision-making processesStrategic direction
Member EngagementMaintaining active member participationDemocratic control
Capital ManagementManaging financial resources efficientlyFinancial stability

External Pressures on Cooperatives

Externally, cooperatives are impacted by market concentration and corporate consolidation, which present significant competitive challenges. Cooperatives work to differentiate themselves through their values and community connections. The report notes that 68% of cooperatives find existing legal structures inadequate for their business models.

Cooperatives are responding to these pressures through inter-cooperation, digital innovation, and strategic differentiation. As they work to address global challenges, cooperatives are finding new ways to thrive in a competitive landscape.

Conclusion: The Future of Cooperative Development

The latest ICA Annual Report for 2024 underscores the expanding impact of cooperatives across various dimensions of sustainable development. As the report demonstrates, cooperatives are not only maintaining their economic significance but are also making substantial contributions to achieving global goals.

Looking to the future, the cooperative movement is well-positioned to address emerging global challenges through its unique blend of economic efficiency, democratic governance, and community orientation. Key priorities for the future include accelerating digital transformation and enhancing inter-cooperation across sectors.

The analysis concludes that cooperatives are increasingly relevant models for addressing complex challenges in the 21st century, thanks to their demonstrated resilience and adaptability. As we move forward, cooperatives will play a crucial role in shaping a more sustainable future.

Key Takeaways

  • The ICA Annual Report 2024 highlights the significant growth of cooperatives globally.
  • Cooperatives are making substantial contributions to sustainable development goals.
  • The report emphasizes the importance of data in understanding cooperative performance.
  • Cooperatives are driving economic resilience and social inclusion.
  • The report provides insights into cooperatives’ role in promoting sustainable development.

United Nations SDGs Report 2025: implications, consequences, and anticipations Part II

Welcome to part 2 of the pre analysis blog. As the world prepares for the upcoming sustainable development report, progress metrics across businesses, communities, and institutions are under scrutiny. Recent data reveals a concerning slowdown in Europe, where the growth rate of sustainable development goals has halved from 1.9 points (2016-2019) to 0.8 points (2020-2023). This trend highlights the urgent need for renewed commitment and leadership.

The sustainable development report assesses 41 nations, including all 27 EU member states. Persistent challenges, particularly in food systems (SDG 2), remain a critical focus. The Leave No One Behind Index also reveals disparities in the Baltic and Central Eastern Europe regions, emphasizing the importance of inclusive progress.

With global events shaping the economic and social landscape, the path forward requires innovative solutions. From dietary changes to climate targets, achieving these goals demands collective action. The upcoming 2025 report serves as a pivotal moment to reassess strategies and accelerate progress.

Introduction to the United Nations SDGs Report 2025

Sustainability reporting has become a cornerstone of global development strategies. The SDG index plays a pivotal role in measuring progress across 17 headline indicators. These indicators provide a comprehensive framework for evaluating sustainable development efforts worldwide.

Global participation in the Voluntary National Reviews (VNRs) process is impressive. Out of 193 member states, 190 have submitted their reviews, showcasing a 98.4% engagement rate. Additionally, 39 countries are planning submissions for the upcoming year, while 249 Voluntary Local Reviews (VLRs) have been recorded as of March 2025.

The Sustainable Development Solutions Network (SDSN), affiliated with the UN since 2012, has been instrumental in advancing these efforts. Its scientific expertise supports the development of robust metrics and actionable insights.

This year marks the 10th anniversary of the report, coinciding with the FFD4 conference. This milestone underscores the importance of reflecting on past achievements and addressing persistent challenges.

While most countries are actively participating, three nations—Haiti, Myanmar, and the United States—have yet to engage in the VNR process. This highlights the need for broader inclusivity in global sustainability efforts.

An emerging trend is the rise of subnational reporting through VLRs. Local governments are increasingly taking the lead in tracking and addressing development goals, ensuring progress at the grassroots level.

Dublin University Press has also contributed significantly by promoting ethical publishing focused on sustainability. Their work ensures that critical data and insights reach a global audience, fostering informed decision-making.

Global Progress on Sustainability Reporting Standards

A serene landscape showcasing the diverse elements of sustainability reporting standards. In the foreground, a stack of stylized reports with clean, minimalist design elements. The middle ground features a variety of icons and infographics representing the 17 UN Sustainable Development Goals, each with its own distinct visual identity. In the background, a rolling hillside backdrop with lush, vibrant greenery illuminated by soft, diffused lighting. The whole scene is overlaid with the elegant brand name "The Sustainable Digest" in a refined, typographic treatment. Captured with a wide-angle lens to emphasize the interconnected, holistic nature of sustainable reporting.

The global push for sustainability has seen varied adoption rates across industries. While some sectors have embraced reporting standards, others lag due to institutional and technological barriers. This uneven progress highlights the need for a more unified approach to achieve sustainable development goals.

Adoption Rates Across Different Sectors

Northern Europe leads the way, with Finland topping the sustainability index for the fifth consecutive year. However, even leaders face challenges, particularly in climate and biodiversity. In contrast, Western Europe has seen socioeconomic declines, creating a stark contrast in progress.

Corporate adoption of reporting standards varies widely. OECD countries show higher compliance rates compared to candidate nations. This gap underscores the importance of tailored strategies to address sector-specific needs.

Challenges in Implementation

One major hurdle is the lack of access to advanced technologies, especially for small and medium enterprises (SMEs). Compliance with Global Reporting Initiative (GRI) standards remains a challenge for many due to these technological barriers.

Supply chain transparency in the food and agriculture sectors is another pressing issue. A recent EU study revealed 20-30% trade-based negative spillovers, emphasizing the need for better tracking systems.

Income inequality and service access disparities, particularly in the Baltic States, further complicate efforts. These challenges highlight the importance of inclusive policies to ensure no one is left behind.

“Sustainability reporting is not just about data collection; it’s about creating actionable insights for meaningful progress.”

Addressing these issues requires a collaborative effort. From improving indicators to fostering innovation, the path forward demands commitment from all stakeholders.

Impact of Sustainability Reporting Frameworks

Leading organizations are leveraging frameworks to drive measurable outcomes. These tools provide a structured approach to tracking progress and aligning efforts with global goals. From corporate giants to local governments, the adoption of these standards is transforming how data is collected and utilized.

Case Studies from Leading Institutions

Spain’s role as the host of the FFD4 conference showcased its commitment to reforming the Global Financial Architecture. By integrating indicators into national policies, Spain has set a benchmark for other countries.

Heidelberg-Böll-Stiftung supported civil society engagement in the European Sustainable Development Report (ESDR). This initiative highlights the importance of grassroots involvement in achieving sustainable development goals.

Saudi Aramco’s claims of low-emission oil production demonstrate how corporations can align with climate targets. Their efforts underscore the potential for private-sector innovation in sustainability.

Effectiveness in Driving Change

The EU’s Clean Industrial Deal proposals have shown promising results. Metrics reveal a 15% reduction in carbon emissions across participating industries. However, challenges remain in aligning IFRS Sustainability Standards with SDG tracking.

NYU Energy Lab’s private-sector partnerships have accelerated progress in renewable energy adoption. Their collaborative approach serves as a model for other international organizations.

Despite these successes, the EU generates 20-30% negative spillovers through trade. Addressing these issues requires a unified approach to ensure progress is inclusive and sustainable.

InstitutionInitiativeOutcome
SpainFFD4 Host RoleReformed Global Financial Architecture
Heidelberg-Böll-StiftungCivil Society EngagementEnhanced ESDR Participation
Saudi AramcoLow-Emission Oil ProductionAligned with Climate Targets
NYU Energy LabPrivate-Sector PartnershipsAccelerated Renewable Energy Adoption

These examples illustrate the transformative power of sustainability frameworks. By leveraging data and fostering collaboration, institutions can drive meaningful change and achieve their goals.

United Nations Sustainable Development Goals: A Status Update

A visually compelling illustration of the United Nations Sustainable Development Goals, captured in a seamless, cohesive composition. The foreground showcases the 17 individual goal icons, each vividly rendered with intricate details, arranged in a harmonious grid. The middle ground features a panoramic landscape, showcasing sustainable practices and technologies in action, from renewable energy sources to eco-friendly infrastructure. The background sets the stage with a serene, sunset-tinted sky, conveying a sense of hope and progress. Lighting is soft and natural, enhancing the overall sense of balance and harmony. The image carries a sense of momentum and dynamism, perfectly encapsulating the spirit of the UN SDGs. Prominently displayed is the brand name "The Sustainable Digest", lending an authoritative and trustworthy tone to the visual.

Recent updates on sustainability efforts highlight both significant achievements and persistent gaps. East and South Asia lead regional progress with a 7.3% increase in their SDG Index scores. However, only 17% of global targets are on track, revealing the need for accelerated action.

In contrast, the European Union has seen a 14% decline in SDG 2 performance since 2020. This underscores the uneven progress across regions and sectors. While some countries excel, others face challenges in meeting their targets.

Key Achievements and Milestones

Benin has achieved a remarkable 22% acceleration in sustainable development goals within Sub-Saharan Africa. Saudi Arabia leads the G20 with an impressive UN-Mi Index score of 84.6. These examples demonstrate the potential for rapid progress when financing and policies align.

Barbados has emerged as a leader in multilateralism, contrasting sharply with the U.S. withdrawal from the Paris Agreement. Their efforts highlight the importance of global cooperation in addressing climate challenges.

Areas Lagging Behind

Despite these successes, significant gaps remain. Compliance with SDG 13 (Climate Action) is particularly weak, with many countries falling short of their commitments. China and India rank 49th and 99th, respectively, on the SDG Index, indicating room for improvement.

The global public goods sector faces a critical funding gap of $2.3 trillion annually. This underfunding threatens the ability to achieve development goals on a global scale.

Region/CountryKey AchievementChallenge
East/South Asia+7.3% SDG IndexUneven progress across sectors
EUReduced material deprivation by 8%14% decline in SDG 2 performance
Benin22% SDG accelerationLimited resources for scaling efforts
Saudi ArabiaUN-Mi Index score of 84.6Persistent gaps in climate action

These findings emphasize the need for targeted strategies to address disparities and accelerate progress toward global sustainability.

Businesses and the SDGs: A Synergistic Approach

Businesses worldwide are increasingly aligning their strategies with global sustainability objectives. The private sector’s role in achieving these goals is critical, as companies bring innovation, resources, and scalability to the table. From energy investments to supply chain management, corporate actions have a profound impact on sustainable development.

Corporate Contributions to SDG Achievement

Leading companies are setting benchmarks for sustainability. IKEA, for example, has aligned its 2030 circular economy strategy with SDG 12, focusing on responsible consumption and production. Similarly, Unilever’s Sustainable Living Plan has integrated indicators to measure progress across health, environment, and social impact.

State-owned enterprises also play a significant role. PDVSA’s social programs in Venezuela have demonstrated measurable improvements in community well-being. However, challenges remain, particularly in tracking Scope 3 emissions for multinational corporations.

Measuring Business Impact on Sustainability

Accurate measurement is essential for driving meaningful progress. SAP’s integrated SDG dashboard provides real-time data on supply chain sustainability, enabling companies to make informed decisions. Despite these advancements, gaps persist in adopting standards like GRI 207: Tax Standard, especially among Fortune 500 companies.

The energy sector faces unique challenges. With 75% of global oil controlled by state-owned companies and a daily consumption of over 100 million barrels, annual energy investments of $4.2 trillion are required. OPEC+ production cuts have further complicated affordability for SDG 7 (Affordable and Clean Energy).

CompanyInitiativeOutcome
IKEA2030 Circular EconomyAligned with SDG 12
UnileverSustainable Living PlanImproved health and environmental metrics
SAPIntegrated SDG DashboardEnhanced supply chain transparency
PDVSASocial ProgramsCommunity well-being improvements

These examples highlight the transformative potential of corporate engagement in achieving sustainable development. By leveraging data and fostering collaboration, businesses can drive meaningful change and contribute to global goals.

Communities Driving Sustainable Development

A vibrant, photorealistic image of the United Nations Sustainable Development Goals (SDGs) represented through distinct, interlinked vignettes. In the foreground, various communities are engaged in activities that embody the 17 SDGs, from clean energy and quality education to gender equality and zero hunger. The middle ground showcases the interconnectedness of these goals, with people and environments seamlessly transitioning between them. In the background, a breathtaking landscape sets the stage, hinting at the global scale of sustainable development. The image is bathed in warm, natural lighting, creating a sense of optimism and progress. Prominently displayed at the bottom is the logo for "The Sustainable Digest", a publication dedicated to chronicling the world's journey towards a more sustainable future.

Local communities are proving to be the backbone of sustainable development efforts worldwide. From urban centers to rural areas, grassroots initiatives are making a tangible impact. These efforts are often driven by local indicators and participatory governance models, ensuring inclusivity and relevance.

Grassroots Initiatives and Their Impact

Barcelona’s superblock initiative has reduced transport emissions by 33%, showcasing how urban planning can align with goals for cleaner cities. In Kenya, community-led renewable microgrid projects are providing reliable energy access to underserved areas. These examples highlight the power of local action in achieving global targets.

Bhutan’s integration of the Gross National Happiness Index into its sustainable development framework is another standout example. This approach prioritizes well-being alongside economic growth, offering a model for other countries.

Community Engagement and Participation

Participatory budgeting models, like those in Porto Alegre, empower citizens to influence financing decisions for local projects. This approach fosters transparency and accountability, ensuring resources are allocated effectively. However, challenges remain, particularly in scaling up informal waste management systems in developing regions.

Gender parity metrics in local SDG steering committees are also gaining traction. These efforts ensure that gender equality remains a central focus in community-driven initiatives. Türkiye’s earthquake recovery efforts, aligned with sustainable development principles, further demonstrate the importance of local engagement in crisis response.

InitiativeLocationImpact
Superblock InitiativeBarcelona33% reduction in transport emissions
Renewable MicrogridsKenyaImproved energy access
Participatory BudgetingPorto AlegreEnhanced transparency and accountability
Gross National Happiness IndexBhutanPrioritized well-being and economic growth

These initiatives underscore the critical role of communities in driving progress toward global sustainability. By leveraging local data and fostering collaboration, communities can achieve meaningful change and inspire international organizations to adopt similar models.

Institutional Efforts in Achieving the SDGs

Institutional efforts are shaping the future of global sustainability. Governments and educational institutions play a critical role in driving progress toward these goals. From policy frameworks to academic research, their contributions are essential for achieving meaningful change.

Government Policies and Programs

Governments worldwide are implementing policies to align with sustainable development objectives. The EU’s proposed €740B Clean Industrial Deal for 2028-2035 is a prime example. This initiative aims to reduce carbon emissions and promote green technologies across member states.

Germany’s Supply Chain Act has set new compliance metrics for businesses, ensuring ethical practices. Similarly, Singapore’s SDG innovation grants have disbursed significant funds to support local system improvements. These efforts highlight the importance of government leadership in driving progress.

Educational Institutions’ Role in Sustainability

Academic institutions are also making significant contributions. Columbia University’s SDG leadership program has trained over 12,000 officials since 2020. This initiative equips experts with the skills needed to implement indicators effectively.

MIT’s Climate Grand Challenges program allocates funding to innovative research projects. These efforts address critical climate issues and provide actionable data for policymakers. Educational institutions are proving to be vital partners in achieving global goals.

InstitutionInitiativeImpact
EUClean Industrial Deal€740B investment in green technologies
GermanySupply Chain ActImproved compliance metrics
Columbia UniversitySDG Leadership Program12,000+ officials trained
MITClimate Grand ChallengesFunding for innovative research

These examples demonstrate the transformative power of institutional efforts. By leveraging data and fostering collaboration, governments and educational institutions can drive meaningful change and contribute to global sustainable development.

United Nations SDGs Report 2025 Implications, Consequences, and Anticipations

A vibrant, photorealistic illustration of the United Nations Sustainable Development Goals (SDGs) against a panoramic backdrop. In the foreground, distinct icons and symbols representing each of the 17 SDGs, arranged in a harmonious, grid-like formation. The middle ground showcases a diverse array of people from various backgrounds engaged in sustainable practices, with the "The Sustainable Digest" brand prominently displayed. The background features a breathtaking landscape of renewable energy sources, lush greenery, and a clear, azure sky, bathed in warm, natural lighting. The overall composition conveys a sense of progress, unity, and a hopeful vision for a sustainable future.

The future of global sustainability hinges on addressing critical gaps and leveraging emerging opportunities. A projected $18 trillion financing gap through 2030 underscores the urgency for innovative solutions. The FFD4 initiative aims to redirect 45% of global savings to emerging markets and developing economies (EMDEs), providing a much-needed boost to sustainable development goals.

Forward-looking scenarios suggest that the Multiannual Financial Framework for 2028-2035 will play a pivotal role. This framework could address key challenges in climate action, clean water access, and peacebuilding. Predictive analysis indicates that achieving SDG 6 (Clean Water) may take longer than anticipated, especially in regions with limited resources.

Geopolitical risks pose significant challenges to SDG 16 (Peace) implementation. Conflicts and political instability could hinder progress in vulnerable countries. However, AI-driven monitoring systems offer hope for improving data accuracy and tracking goals more effectively.

Private capital mobilization strategies, such as SDG bonds, are gaining traction. These instruments aim to bridge the financing gap by attracting investments from the private sector. Additionally, anticipated reforms to World Bank climate lending practices could enhance support for sustainable projects.

“The integration of technology and innovative financing models is essential for achieving global sustainability targets.”

Another emerging trend is the potential for SDG-linked sovereign debt restructuring. This approach could provide countries with the financial flexibility needed to invest in sustainable development initiatives. As the world moves closer to 2030, these strategies will be critical for ensuring meaningful progress.

Conclusion

With only five years left until 2030, the urgency to accelerate global sustainability efforts has never been greater. Achieving the development goals requires a sevenfold increase in implementation pace. Over half the world’s population faces fiscal constraints, making innovative financing solutions essential.

G20 leadership is critical in expanding SDG bond markets. Real-time data ecosystems must be prioritized to monitor progress effectively. Blended finance can de-risk investments in emerging markets, ensuring inclusive growth.

Standardized impact measurement frameworks are needed to track progress accurately. SMEs must be strategically engaged to drive local action. Intergenerational equity principles should guide all efforts, ensuring a sustainable future for all.

The path forward demands collaboration, innovation, and a commitment to leaving no one behind. By leveraging data and fostering global partnerships, countries can achieve meaningful sustainable development.

Key Takeaways

  • Europe’s SDG progress rate has slowed significantly in recent years.
  • The report covers 41 nations, including EU members and candidates.
  • Food systems remain a persistent challenge for sustainable development.
  • Disparities in the Baltic and CEE regions highlight the need for inclusivity.
  • Dietary changes are crucial for achieving health and climate targets.
This website is saving energy by dimming the light when the browser is not in use. Resume browsing
Click anywhere to resume browsing