The current focus on labor and the earth highlights how people interact with nature with peculiar perspective during Black History Month. It is also a great time to study Environmental Justice and social growth. We see that the fight for fair pay is much like the fight for clean air and water.
In the past, african americans helped build this nation with skill and care. They used smart ways to farm and manage the land from the very start. These ecological efforts were vital to survival and national growth.
Sadly, most school books leave out these vital stories of nature and work. They also gloss over details during Black History Month. Theses stories and the individuals of this narrative however, were the first to use many green methods we see today on modern farms. Their stewardship was born from necessity and a deep connection to the soil.

Now, black history month 2026 shows us that nature and equity go hand in hand. Leaders like A. Philip Randolph linked civil/labor/human rights to the struggle against industrial harm. This connection remains a cornerstone of modern advocacy.
Leaders saw that pollution often follows the color line with unfortunate accuracy. Getting true balance means that everyone should have a safe and green home for their families. Civil rights must include the right to a healthy, sustainable world.
The Legacy of Black Environmental Stewardship: Setting the Context
While mainstream narratives often celebrate figures like John Muir, the deep-rooted history of Black environmental stewardship remains an unsung pillar of conservation. For too long, the conventional story of environmentalism has focused on white, middle-class concerns. This perspective ignores the vital contributions of black people who have defended their land for centuries. This erasure suggests that protecting the planet is a recent interest for minority groups, but the reality is far more complex.
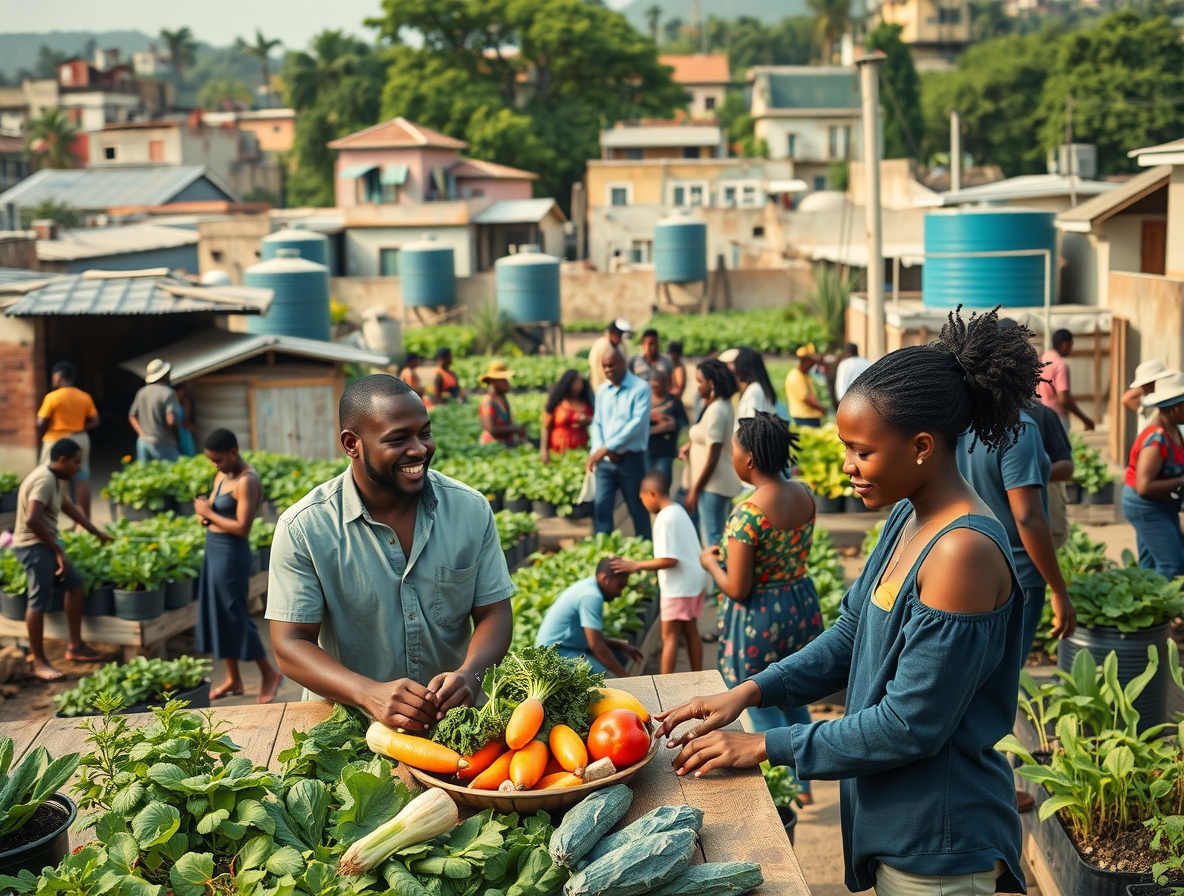
Long before “sustainability” became a popular corporate buzzword, African American families practiced resource conservation as a way of life. This stewardship was not just about loving nature; it was a strategy for survival and resilience. Indigenous African wisdom regarding agriculture and water management traveled across the Atlantic with enslaved peoples. These communities transformed scarcity into abundance through sheer ingenuity, even when they lacked legal rights to the soil they enriched.
The Legacy of Black Environmental Stewardship: Setting the Context Continuing…
Mainstream movements often separated nature from people, yet Black stewardship recognized that human health and ecological health are the same. This black history shows that environmental action and social justice are inseparable priorities. Environmental justice emerged from a need to protect both the land and the people who depend on it most directly. This legacy proves that the fight for environmental justice is a fundamental part of black history, black history month, and American progress.
| Focus Area | Mainstream Narrative | Black Stewardship Legacy |
|---|---|---|
| Primary Goal | Wilderness preservation for recreation | Cooperative land use and survival |
| View of Nature | Separate from human society | Inseparable from human dignity |
| Methodology | Exclusionary land management | Sustainable resource allocation |
Understanding this historical context changes how we view modern climate challenges. It reveals that solutions for our planet already exist in ancestral practices and grassroots movements. Strong leaders have consistently demonstrated that we cannot fix the environment without also addressing racial inequity. The following points highlight how this stewardship took shape over time:
- Agricultural Ingenuity: Enslaved people used African farming techniques to sustain themselves and build American wealth without receiving credit.
- Resilient Gardens: During the Great Depression, victory gardens became essential tools for food security and community autonomy.
- Protest as Protection: Civil Rights leaders targeted polluting industries long before modern regulations existed.
- Interconnected Health: Grassroots activists proved that clean air and water are basic human rights for everyone, not just the elite.
The environment is not just where we go for a hike; it is where we live, work, play, and pray.
From Pre-Colonial Sustainability to Industrial Exploitation

The transition from sacred land stewardship in Africa to the brutal plantation systems of the Americas marks the genesis of environmental injustice. This shift reflects a move from ecological harmony to a system of extraction and discrimination. Understanding this era is crucial to black history and the origins of modern climate activism.
Indigenous African Environmental Wisdom and Sacred Land Practices
Pre-colonial African societies developed sophisticated environmental management systems. They recognized land as a sacred trust rather than an extractable commodity. These communities practiced crop rotation and managed water through collective governance to ensure long-term survival.
Modern permaculture is only now “rediscovering” these techniques with considerable fanfare and notably less humility. These practices embodied what we now define as sustainability. They integrated human life into the natural cycle rather than standing apart from it.
However, they understood it as a spiritual relationship with the Earth. This spiritual bond acknowledged human dependence on natural systems and ecological balance. Such values ensured high diversity across the landscape for future generations.
Wangari Maathai, founder of the Green Belt Movement, later revived these connections. By empowering women to plant millions of trees, she linked conservation to human dignity. Her work showed that protecting ecosystems is a powerful tool for poverty reduction.
Native American leaders also shared this view of the sacred Earth during the formation of the environmental justice movement. They helped early advocates see the planet as a living entity that requires protection. This cross-cultural wisdom remains a cornerstone of ecological resistance.
Slavery, Agricultural Labor, and the Foundation of Environmental Injustice
The transatlantic slave trade did not just extract human beings; it severed them from their environmental knowledge. It then exploited that very expertise to build agricultural wealth in the Americas. This forced labor transformed landscapes while denying enslaved peoples any agency over the land.
This era marks a painful chapter in black history month and black history in general. The plantation system created America’s original “sacrifice zones.” These were landscapes that lacked variety because they served monoculture cash crops for global trade.
Enslaved workers bore the brunt of this environmental degradation without seeing the profits. This established the template for modern environmental racism and industrial pollution. Post-emancipation systems like sharecropping continued this exploitation under new names.
Planners concentrated environmental hazards in Black communities through deliberate structural choices. Yet, despite these barriers, Black communities maintained their ecological wisdom and fought for progress. This resilience highlights the enduring contributions black ancestors made to the land.

| Feature | Pre-Colonial African Societies | Industrial Plantation System |
|---|---|---|
| Land Perception | Sacred trust and community heritage | Extractable commodity and capital |
| Ecological Goal | Biodiversity and long-term balance | Monoculture and immediate profit |
| Human Relation | Spiritual stewardship and interdependence | Forced labor and exploitation |
The Birth of Environmental Justice: Warren County’s Pivotal Protest
While many view conservation as a quest for pristine wilderness, the residents of Warren County redefined it as a struggle for survival. In 1981, North Carolina officials designated this predominantly Black and economically distressed county as a dump site for 60,000 tons of PCB-contaminated soil.
The state chose this location despite a shallow water table that posed a direct threat to the local groundwater. This decision suggested that officials believed poverty and race would equal a lack of resistance. They were profoundly mistaken.
This attempt to bypass safety standards in a marginalized area became a catalyst for change across the united states. It proved that the fight for a clean environment was inseparable from the fight for human dignity and equality.
1981-1982: When Civil Rights Met Environmental Action
The resistance in Warren County signaled a massive shift where the traditional environmental movement finally adopted the tactics of the streets. Local residents and activists organized six weeks of non-violent protests to block 6,000 trucks filled with carcinogenic soil.
People and individuals of kind literally laid their bodies on the road to stop the delivery of toxic waste. This courageous act of civil rights defiance led to over 500 arrests. It was the first time citizens were jailed for defending their right to a non-toxic neighborhood.
These demonstrations quickly captured national attention, forcing the broader public to look at the ugly reality of hazardous waste disposal. The protest proved that “green” issues were not just for the wealthy, but a matter of life and death for the disenfranchised, marginalized, and lower working class.
While the landfill was eventually built, the social cost was too high for the government to ignore. This specific moment in North Carolina history created the framework for what we now call environmental justice.
Rev. Benjamin Chavis and the Definition of Environmental Racism
While serving time in the Warren County Jail, civil rights leader Rev. Benjamin Chavis formulated a concept that changed the political landscape forever. He realized that the targeting of his community was not an accident of geography, but a symptom of systemic racism.
“Environmental racism is racial discrimination in environmental policy-making and the enforcement of regulations and laws, the deliberate targeting of communities of color for toxic waste facilities.”
Rev. Benjamin Chavis
This definition provided a necessary name for the racism embedded in land-use policy. It allowed other communities, from Cancer Alley in Louisiana to Flint, Michigan, to see that their local crises were part of a national pattern.
The struggle in Warren County lasted decades, as the toxic chemicals were not fully remediated until 2004. However, the movement it birthed remains a powerful force in modern civil rights advocacy. Environmental justice is no longer a niche concern; it is a central demand for a fair society.

| Key Milestone | Historical Significance | Outcome/Impact |
|---|---|---|
| 1981 Location Choice | Warren County selected for PCB dump. | Sparked the first major intersection of race and environment. |
| 1982 Mass Protests | Over 500 arrests of non-violent activists. | Garnered global media coverage for the cause. |
| Chavis’s Definition | Coined the term environmental racism. | Provided a legal and social framework for future advocacy. |
| 2004 Site Cleanup | Final detoxification of the Warren County site. | Proved the long-term cost of discriminatory waste policies. |
Founding Figures: The Architects of Environmental Justice

Identifying systemic failures is one thing, but proving they are the result of deliberate policy requires a special kind of courage and academic precision. These visionary leaders did not merely observe the world; they deconstructed the hidden biases within our physical landscapes. By blending rigorous research with community heart, they forced the world to acknowledge that ecology and equity are inseparable.
Dr. Robert Bullard: Proving Systemic Environmental Racism
Dr. Robert Bullard is widely recognized as the father environmental justice. In the early 1980s, his pioneering research provided the first systematic evidence of environmental racism. Robert Bullard famously mapped toxic facility locations against demographic data in Houston to reveal shocking patterns.
He discovered that race, more than income, predicted where waste was dumped. Dr. Robert published his landmark book Dumping in Dixie in 1990, showing how black communities were unfairly targeted. His work proved that dr. robert bullard was right: environmental policy often protected some neighborhoods while sacrificing others.
By using data, robert bullard transformed community complaints into an undeniable academic discipline. Dr. Robert shifted the focus toward justice and public health. Today, the legacy of dr. robert bullard continues to guide urban planning. Finally, robert bullard remains a voice for the voiceless while dr. robert helped define a new era of civil rights.
Hazel M. Johnson: Grassroots Power in Chicago’s Altgeld Gardens
While scholars mapped data, Hazel M. Johnson organized the streets of Chicago. Known as the “Mother of Environmental Justice,” she founded People for Community Recovery in 1979. Her neighborhood, Altgeld Gardens, sat in a “toxic doughnut” of industrial facilities and waste sites.
Johnson didn’t wait for outside experts to validate her reality. She empowered residents to document their own health crises, from asthma to cancer clusters. Her work proved that lived experience is a powerful form of justice.
She brought national attention to the harms facing black communities, demanding that zip codes shouldn’t dictate lifespans. Johnson showed that grassroots leaders can force institutional accountability. She proved that community monitoring is just as vital as laboratory science.
Wangari Maathai: Connecting Conservation to Human Dignity
Across the ocean, Wangari Maathai expanded the movement’s scope to a global scale. As the first African woman to win the Nobel Peace Prize, she founded the Green Belt Movement in 1977. She recognized that planting trees was a tool for both ecological restoration and human rights.
Maathai empowered women to plant tens of millions of trees to combat soil erosion and climate change. She linked environmental conservation directly to sustainable livelihoods and political freedom. Her work demonstrated that you cannot protect the land without protecting the people who depend on it.
“The tree is a wonderful symbol for the peace and hope which can come from a sustainable management of our environment.”
— Wangari Maathai
Her legacy ensures that modern sustainability efforts remain rooted in community dignity and social empowerment. Maathai’s courage showed that environmentalism divorced from social equity is fundamentally incomplete.

| Figure | Recognized As | Primary Method | Key Contribution |
|---|---|---|---|
| Robert Bullard | Father of Environmental Justice | Data Mapping & Research | Proved race as the primary predictor of waste siting. |
| Hazel Johnson | Mother of Environmental Justice | Grassroots Organizing | Led community monitoring in Chicago’s Altgeld Gardens. |
| Wangari Maathai | Nobel Peace Prize Laureate | The Green Belt Movement | Linked tree-planting with women’s rights and democracy. |
2026 Black History Month, Environmental Justice, and Civil/Labor/Human Rights: The Contemporary Movement
As we observe 2026 black history month, the dialogue surrounding environmental justice has evolved into a sophisticated blend of activism and commerce. This era demands a profound reckoning with how racial justice and ecological health intersect. Modern movements for civil and labor rights now find their most potent expression in the intersection of climate action and socioeconomic equity.
The contemporary landscape of this history month reflects a dynamic shift toward systemic change and economic empowerment. We see a transition from reactive protests to proactive, sustainable industry building. This evolution honors the legacy of justice while forging new paths for the next generation of pioneers.
Leah Thomas and the Rise of Intersectional Environmentalism
Leah Thomas has fundamentally shifted the green narrative by coining the term “Intersectional Environmentalist.” Her framework acknowledges that environmental harm disproportionately impacts marginalized communities of color. Through her platform and book, she advocates for a brand of sustainability that is inclusive and inherently just.
Thomas argues that protecting the planet requires an unwavering commitment to social equity and the dismantling of systemic barriers. Her work demands that mainstream organizations move beyond superficial diversity initiatives. She insists on a fundamental restructuring that centers those bearing the heaviest environmental burdens.
“We cannot save the planet without uplifting the voices of those most impacted by its destruction, ensuring that our green future is accessible to everyone.”
Her approach articulates that environmentalism ignoring race or class merely perpetuates existing inequities. By focusing on environmental justice, Thomas ensures that conservation efforts do not ignore the plight of urban pollution hotspots. This intellectual shift has become a cornerstone of the movement during this history month.
Black-Owned Sustainable Businesses Transforming Industries
The rise of Black-owned sustainable businesses proves that environmental leaders extend far beyond traditional activism. Every ceo in this space demonstrates that building a better economy requires integrating ethics into the very foundation of a company. They are proving that profitability and planetary health are not mutually exclusive goals.
Aurora James: Ethical Fashion and the 15 Percent Pledge
Aurora James, the ceo of Brother Vellies, has redefined luxury through the lens of traditional African craftsmanship. Her brand uses vegetable-tanned leathers and recycled tire materials to create high-end goods. This model enriches source communities rather than extracting from them in a predatory manner.
Beyond fashion, James launched the 15 Percent Pledge to address economic inequality in retail spaces. This initiative urges major retailers to dedicate shelf space proportional to the Black population. It recognizes that rights to economic participation are essential for long-term community sustainability.
Karen Young and SaVonne Anderson: Sustainable Consumer Products
Karen Young founded OUI the People to tackle the beauty industry’s massive plastic waste problem. Inspired by her upbringing in Guyana, she promotes refillable glass bottles and durable stainless steel razors. Her company challenges the “disposable” culture that often harms low-income neighborhoods and others through landfill overflow.
SaVonne Anderson’s Aya Paper Co. provides an eco-friendly alternative in the greeting card market. Her products use 100% recycled materials and plastic-free production methods right here in the U.S. By prioritizing diversity in supply chains, she shows how small consumer choices support a larger green future.
Linda Mabhena-Olagunju and Sinah Mojanko: African Energy and Recycling Leadership
In South Africa, Linda Mabhena-Olagunju leads DLO Energy Resources Group, a powerhouse in renewable energy. She develops large-scale wind and solar farms that combat climate change while closing energy gaps. Her leadership ensures that Black women are at the forefront of the continent’s green energy transition.
Sinah Mojanko’s Tiyamo Recycling transforms waste management into a vehicle for economic opportunity. Her model empowers unemployed individuals to become entrepreneurs within the recycling sector. This approach solves social and ecological challenges simultaneously, proving that justice can be found in the circular economy.
| Leader | Organization | Key Innovation | Social Impact |
|---|---|---|---|
| Leah Thomas | Intersectional Environmentalist | Intersectional Framework | Centering marginalized voices |
| Aurora James | Brother Vellies / 15% Pledge | Recycled Tire Materials | Economic retail equity |
| Linda Mabhena-Olagunju | DLO Energy Resources | Wind and Solar Farms | Renewable energy access |
| Karen Young | OUI the People | Refillable Glass Systems | Plastic waste reduction |
The Ongoing Struggle: Environmental Racism in Contemporary America

Forty years after the first major protests, the systems of environmental racism still work with a quiet efficiency. It remains vital for black communities to stay informed about these geography-based hazards. Today, the maps of risk often trace the same lines drawn by historical exclusion.
The Statistics Behind Environmental Inequality Today
Rev. Benjamin Chavis points to a hard truth about our modern era. Roughly 20% of all african americans are exposed environmental hazards today. In contrast, less than 2% of white families face these same risks.
This tenfold gap persists regardless of wealth or education levels in these communities. Experts often call this “policy violence” because it stems from choices made in high-level offices. Older african americans die three times more often from pollution-related illnesses than their white peers.
These numbers prove that racism exists in the very air some people breathe. In Flint, Michigan, the water crisis showed the lethal side of bad environmental policy. Corroded pipes poisoned a majority-Black city because officials prioritized costs over public health.
Similarly, “Cancer Alley” in Louisiana exposes communities to toxic air from chemical plants. Industrial waste and air toxins often target these specific areas. This leaves residents exposed environmental poisons that whiter areas successfully avoid.
Policy Rollbacks and the Dismantling of Environmental Justice Protections
National progress often depends on who sits in the Oval Office. The Biden administration used the Inflation Reduction Act to fund climate solutions and equity projects. These efforts gave hope to many who seek better environmental protection.
However, recent political changes often lead to a dismantling of these vital safety nets. Federal policy shifts have led to the removal of justice-focused language from many official records. Cutting budgets for these programs acts as a form of active discrimination.
Leaders often treat environmental protection for the vulnerable as a luxury rather than a right. This trend confirms that racial discrimination in the united states is not just a ghost of the past. It is an ongoing choice made by current lawmakers.
Even with these rollbacks, grassroots power remains a beacon of hope. People are organizing to fight for a cleaner climate and safer neighborhoods. They understand that a single policy change can harm their health for generations.
By building local strength, they resist the environmental racism and systemic racism that dictates where toxic waste is dumped. Their persistence proves that collective action is the best shield for black communities.
| Community Group | Primary Environmental Hazard | Key Statistic or Impact |
|---|---|---|
| Puerto Rican Residents | Respiratory Irritants | Double the national asthma incidence |
| Hopi Nation | Heavy Metal Contamination | 75% of water supply contains arsenic |
| Cancer Alley (LA) | Petrochemical Carcinogens | Cancer rates far above national average |
| Older Black Adults | Industrial Particulates | 3x mortality rate from air pollution |
| Flint, Michigan | Lead-Tainted Water | State-wide denial of toxic pipe corrosion |
Conclusion: From Labor Rights to Environmental Justice—Building Our Collective Future
The 2026 Black History Month theme, “African Americans and Labor,” reveals that environmental justice is essentially labor justice. Fighting for fair wages and breathable air are inseparable goals for communities seeking equity. Workers breathing fumes on factory floors and families in nearby homes face the same exploitative system.
History (through Black History Month) shows us this connection through the work of A. Philip Randolph and Addie Wyatt. They bridged labor rights with civil rights during the 1963 March on Washington. Even Frederick Douglass championed economic justice alongside abolition, proving that workplace dignity sustains life for everyone.
These early contributions paved the way for the 1991 People of Color Environmental Leadership Summit. This landmark event established 17 principles that the United Nations now recognizes. Analysis by the father of environmental justice, Dr. Robert Bullard, helped activists expose the patterns of racial discrimination.
Today, the modern environmental movement faces complex hurdles, including legislative rollbacks and the global climate crisis. We simply cannot address climate change while tolerating the survival of environmental justice gaps. A resilient future demands that we dismantle the siloed approach to social rights and ecological health.
Building collective progress depends on staying involved, as Reverend Benjamin Chavis often emphasizes to his followers. We must honor civil rights icons by pushing for justice in every zip code. True change occurs when people refuse to let their spirits be broken by the immense challenges ahead.
Celebrating the 2026 theme means transforming commemoration into a deep, lasting commitment to the earth and its people. Every step toward sustainability is a step toward progress for all of humanity. Strong action today ensures that the next generation inherits a planet defined by balance and fairness.

Key Takeaways
- Sustainability requires addressing historical racial and economic gaps.
- The current theme connects industrial work to land stewardship.
- Environmental equity is a long-standing civil rights issue.
- African American innovations in farming started centuries ago.
- Protests against toxic waste helped shape modern green policy.
- Clean air and water are fundamental to human dignity.