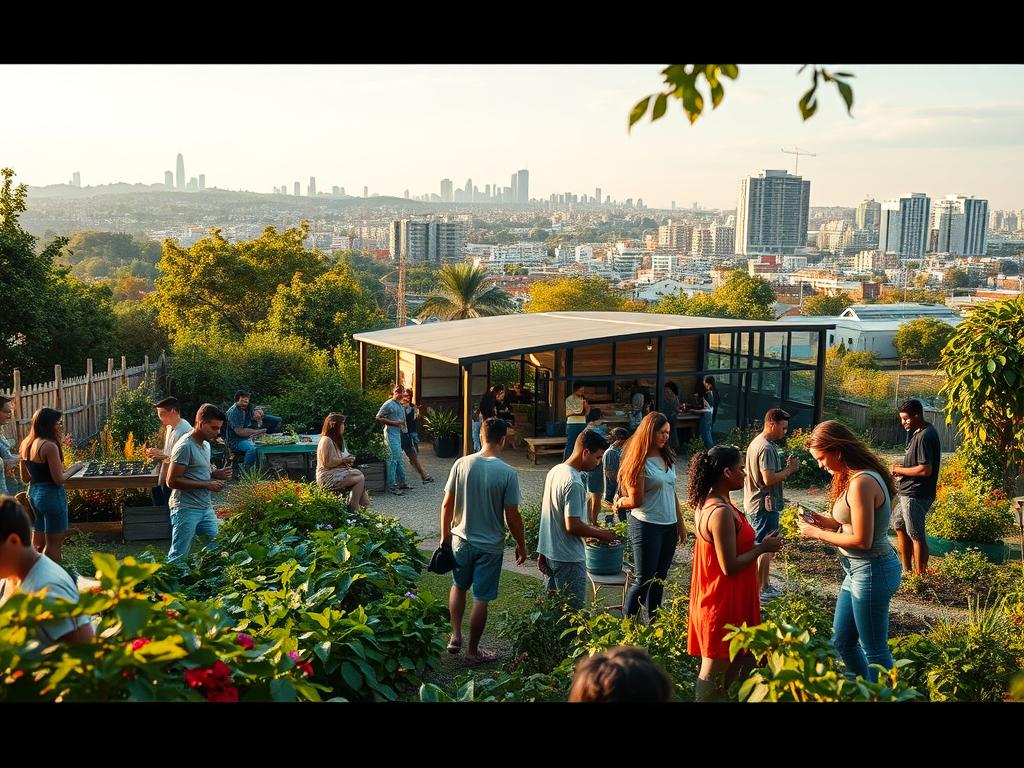

Long before we called it “green building,” Indigenous architecture in what’s now the United States was already doing it right. These ancient homes were built to withstand extreme weather, using local materials and careful observation. They outperformed many modern “eco” homes in terms of cost and efficiency.
This article looks at proto-sustainability as a way to understand ancient wisdom. We explore how buildings were designed to work with their environment, respecting the cultures that built them. Every detail, like a wall assembly, is part of a larger system of care for the land.
We compare traditional U.S. buildings with modern off-grid homes like earthships and cob houses. Both use natural materials and smart designs to stay cool and warm. But, they differ in how they use industrial materials and follow building codes.
Next, we’ll take you on a tour of U.S. climates and dive into materials like cob, adobe, and rammed earth. We’ll also focus on water, site selection, and how buildings fit into their landscapes. Finally, we’ll offer advice on how to draw inspiration without disrespecting other cultures.

What Proto-Sustainability Means in Architecture
The concept of proto-sustainability is best understood by looking back. These buildings were designed to work well with local ecosystems and to be easily repaired. The goal was to keep them running year after year, without taking too much from the future.
Defining proto-sustainability vs. modern green building
Today, we often focus on modern green building standards. These include LEED scores and net-zero goals. Yet, the debate between green building and traditional architecture remains important.
Proto-sustainable design is more like a practical guide. It uses materials that are easy to find and maintain locally. These materials are also better for the environment because they don’t end up in landfills.
| Lens | Proto-sustainable practice | Modern green building frameworks |
|---|---|---|
| Primary proof | Long performance in one place across generations | Modeled performance plus third-party rating or certification |
| Supply chain | Local sourcing; short transport; seasonal availability | Often global sourcing; specialized assemblies and imports |
| Maintenance model | Planned upkeep as routine community work | Scheduled service; sometimes specialist-driven maintenance |
| Materials mindset | Life-cycle building materials chosen for repair and reuse | Mix of low- and high-embodied-energy products, depending on budget and goals |
| Risk profile | Known performance under local weather patterns | Can be excellent, yet may rely on tight tolerances and precise installation |

Why Indigenous knowledge systems matter today
Indigenous knowledge systems are not just stories. They are valuable data gathered through hard experience. This includes learning from weather and natural events.
Traditional ecological knowledge (TEK) offers insights that go beyond numbers. It connects the health of habitats, settlement patterns, and daily life. This approach tests design choices over seasons, not marketing cycles.
How climate, culture, and materials shaped design
In climate-adaptive architecture, design follows weather patterns. Buildings use thick walls, overhangs, and tight entries to manage temperature and wind. Raised floors help deal with moisture.
Culture also influences design. Buildings are designed to organize people, not just air. They reflect shared labor, privacy, and ceremonial life. In many places, “sustainable” meant “works here, repeatedly,” without harming local resources.
Proto-Sustainability ancient housing indigenous buildings earthships cob houses

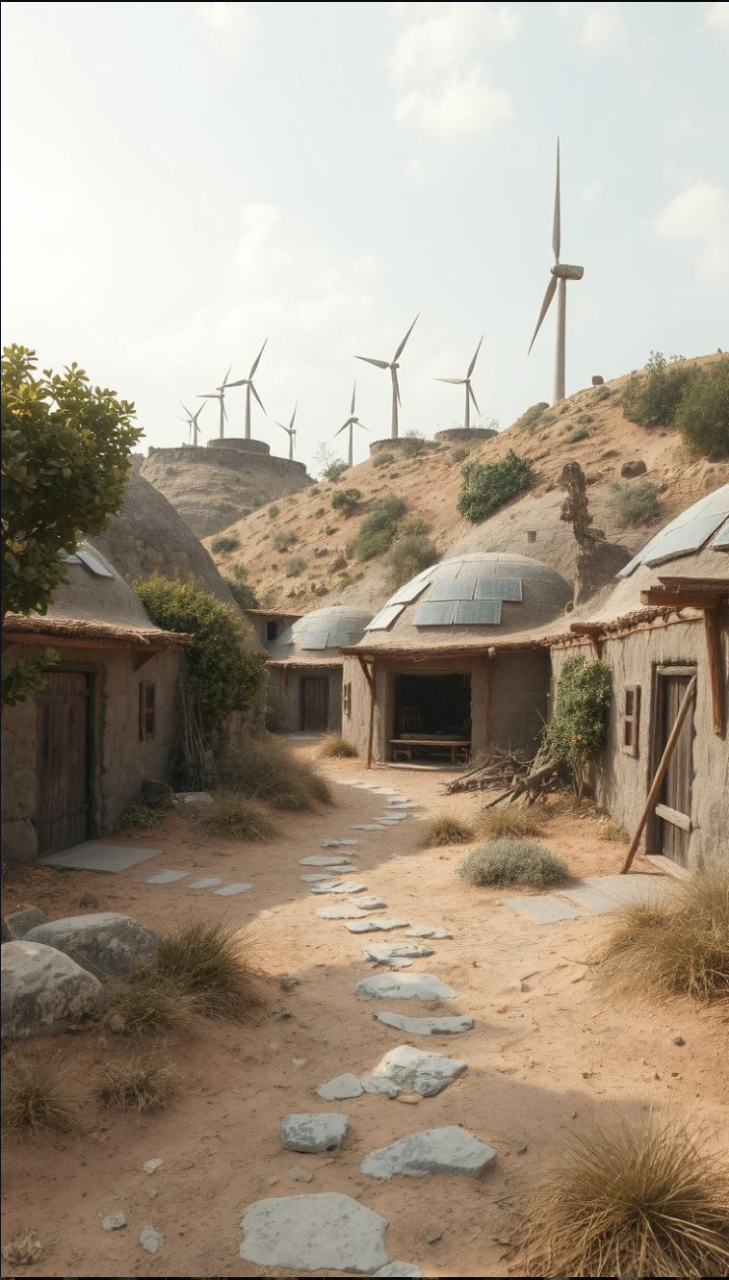
The term Proto-Sustainability sounds new, but its roots are ancient. Builders long ago designed homes to work with nature. They aimed for comfort using less energy.
Today, we’re rediscovering these old ideas. They focus on how buildings work and use resources wisely. Indigenous architecture is more than just a prototype; it’s a living part of our culture.
Connecting ancient building logic to earthships and cob houses
Indigenous buildings managed heat with thick walls and smart openings. Earthships use earth-berming and heavy walls to keep temperatures stable. It’s like engineering a house to work like a system.
Cob houses are built with clay, sand, and straw. Their walls are dense and can be fixed in place. This method is not regress; it’s a smart use of materials.
Shared principles: thermal mass, passive solar, and local sourcing
Across time, the same ideas keep coming back. Passive solar homes use sun to warm them in winter and cool them in summer. Thermal mass walls store heat and release it slowly.
Building with local materials is key. It reduces transport needs and makes repairs easier. The right material choice is crucial for success.
| Design focus | Common thread in older practices | How earthship design applies it | How cob house principles apply it | Typical constraint in the U.S. |
|---|---|---|---|---|
| Heat storage and release | Thick envelopes buffer daily temperature swings | Uses bermed shells and interior mass to stabilize indoor temps | Relies on dense earthen walls to moderate peaks and dips | Thermal mass walls can underperform without added insulation in cold zones |
| Solar orientation | Openings and room layout follow seasonal sun paths | Targets sun-facing glazing for winter gain and controlled shading | Pairs window placement with wall mass to reduce overheating | Lot shape, setbacks, and neighboring shade can limit exposure |
| Material sourcing | Use what is nearby and workable; replace parts over time | Often mixes local earth with salvaged industrial inputs like tires or bottles | Uses site or regional soil blends; repairs can reuse the same mix | Soil testing, moisture detailing, and lender expectations add friction |
| Moisture management | Form, roof lines, and site drainage protect walls | Depends on membranes, drainage layers, and precise detailing | Depends on plasters, capillary breaks, and roof overhangs | Building codes may require specific assemblies and inspections |
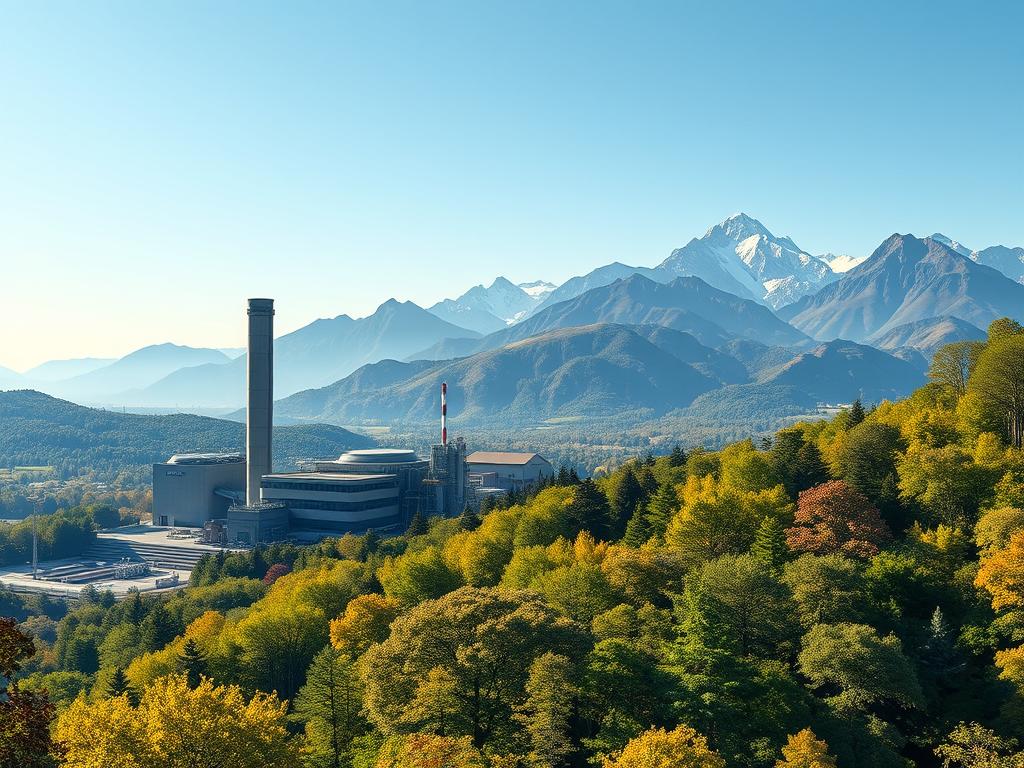
Where modern interpretations diverge from traditional practice
Today’s buildings often focus on individual needs, not community. This is different from Indigenous structures, which were deeply connected to their people and land.
Modern builds might use industrial materials, while traditional ones relied on local resources. This can lead to higher environmental impacts, especially if materials are imported.
In cold climates, mass alone may not be enough to keep buildings warm. This doesn’t mean the ideas are wrong; it just shows they need to be adapted for today’s conditions.
Indigenous Building Principles That Reduce Environmental Impact
Before we worried about carbon, Indigenous builders built smartly. They used what was easy to carry and avoided hard-to-get resources. This simple rule helped many communities in the U.S. build sustainably.
Building with local, renewable, and salvaged materials
They chose materials based on what was nearby. They used earth, wood, reeds, grasses, stone, and hides. This choice saved time, tools, and energy.
Salvage building was also key. They reused materials after storms or repairs. This way, they didn’t waste anything. Today, we call this circular construction.
Designing for durability, repairability, and reuse
They built to last, not just to look good. They made walls thick, roofs overhang, and floors raised. This made their homes last longer with less work.
They also made houses easy to fix. They could replace parts without tearing everything down. This was better than modern buildings that hide problems until they’re expensive to fix.
| Principle | Traditional performance logic | Environmental effect | Maintenance pattern |
|---|---|---|---|
| Use what the site offers | Earth, stone, timber, reeds, and grasses selected for climate fit and availability (local materials) | Less transport demand; fewer processing steps for low-impact building | Periodic harvesting and careful replenishment of renewable materials |
| Protect the structure | Thick walls, raised floors, and roof overhangs reduce sun, rain, and splash-back damage | Longer lifespan means fewer replacement cycles and less waste | Routine inspections; small fixes prevent large rebuilds |
| Make parts replaceable | Finish layers and sacrificial elements can be renewed without disturbing the core (repairable housing) | Lower material throughput over time; fewer landfill-bound removals | Re-plastering, patching, re-thatching done with basic tools |
| Keep materials in circulation | Recovered poles, stones, and boards reused when possible (salvage building) | Supports circular construction by extending component life | Sorting, storing, and reusing parts as needs change |
Low-waste construction methods and closed-loop thinking
They built on-site to reduce waste. This meant less packaging and offcuts. They also made sure materials could go back to nature easily.
This way of building is still smart today. It’s about planning well and avoiding waste. It makes buildings last longer and need less fixing.
Earth-Based Materials: Cob, Adobe, Rammed Earth, and Clay

Earth can be a great material for building, but it needs careful handling. The success of earthen buildings depends on the soil, wall shape, and climate. It’s important to get the details right, especially with flashing.
Start with a solid base and a strong roof. This includes raised foundations, capillary breaks, and big roof overhangs. Then, focus on how the walls handle heat and moisture.
Cob house composition and performance basics
A cob house is made from clay-rich soil, sand, straw, and water. The mixture is pressed into walls by hand. These walls can hold weight if they’re thick enough.
The thickness of cob walls is not just for looks. It also helps with keeping warm and managing moisture. You can shape the walls easily, but remember to add lintels over openings.
Adobe bricks vs. cob walls in different climates
Adobe uses sun-dried bricks, making it easier to plan and fix. You can replace a single brick without redoing the whole wall.
Cob walls are built on-site, fitting well with unique designs. In hot areas, both types keep the inside cool. But in wet places, they need extra care to handle moisture.
Rammed earth: density, strength, and thermal stability
Rammed earth walls are made by pressing damp soil into forms. They are strong and keep heat well. You can even make them look modern.
Old mixes just used soil and compaction. Now, some add cement for strength. But this can increase carbon emissions.
Breathability, moisture control, and natural plasters
Earthen walls can handle indoor humidity. But they need protection from too much water. Also, they should be able to breathe.
Clay plaster is a good finish because it’s easy to fix. Lime can make it last longer in wet spots. Both work best when the wall can dry and the roof keeps rain away.
| Material approach | How it is made | Strength and structure notes | Moisture and finish strategy | Best-fit climate signal in the U.S. |
|---|---|---|---|---|
| cob house walls | Clay-rich soil, sand, fiber, and water placed as a continuous mass | Thick walls carry load; curves add stability; openings need lintels and thoughtful reinforcement | Relies on drying potential; clay plaster or lime finish protects while staying compatible with vapor permeability | Performs well where rain is manageable with overhangs; needs extra care in humid or flood-prone areas |
| adobe construction | Sun-dried bricks laid with earthen mortar in modular courses | Predictable units support standard details; seismic strategies often include reinforcement and bond beams | Requires raised bases and durable exterior coats; finish choices should respect hygrothermal design | Strong match for hot-arid zones with high diurnal swing; detailing becomes decisive in mixed-wet climates |
| rammed earth walls | Soil compacted in forms in thin lifts; sometimes stabilized with cement | High density and compressive strength; stabilized mixes increase consistency but change the carbon story | Surface can be left exposed if protected from splash and runoff; compatible sealers must not trap moisture | Works across many regions when protected from driving rain; excels where thermal mass is a priority |
Passive Heating, Cooling, and Ventilation Before Modern HVAC
Long before thermostats, Indigenous builders in North America used simple rules for comfort. They let the site do the work. This meant buildings faced the sun and winds, and were built to fit the climate.
Walls and floors used thermal mass to keep temperatures steady. Earth-berming and partial burial helped by using the ground’s stable temperatures. Shading strategies, like overhangs, cut glare and heat gain.
Ventilation was designed with purpose. Openings were placed to let in cool air and let out warm air. This natural flow was key to comfort.
In hot, dry areas, cooling was clever. Thermal mass absorbed heat during the day. At night, it released heat by opening pathways for cool air.
Cold comfort came from smart design. Buildings were placed to catch winter sun and were built to keep drafts out. This made heating more efficient.
| Passive toolkit | How it works in practice | Primary comfort payoff |
|---|---|---|
| Orientation to sun and prevailing winds | Places entrances, courtyards, and main rooms where winter sun helps and harsh winds are deflected | Better solar gain with less infiltration |
| Operable openings for natural ventilation | Uses cross-breezes and adjustable vents to match daily and seasonal conditions | Lower indoor heat and improved air freshness |
| High/low vent pairing using stack effect | Lets rising warm air escape high while pulling cooler air in low, especially during cooking | More reliable airflow without fans |
| Thermal mass and night flushing | Stores heat in dense materials by day; releases and resets with cool night air | Cooler evenings and steadier temperatures |
| Shading strategies and sheltered outdoor space | Blocks high summer sun with overhangs, porches, and recessed walls | Reduced overheating and glare |
Modern passive-house thinking is similar. It starts by reducing loads before adding equipment. The difference is in approach. Indigenous methods treated buildings as living systems, adjusted daily.
Regional Case Studies Across the United States

Across the map, Indigenous architecture United States shows how climate shapes buildings. The shape, material, and labor all depend on the local climate.
What works in one place might not work in another. Copying a design without adapting it is like wearing a parka in Phoenix. It’s not practical.
Southwest adobe and pueblo-style communities
In Southwest adobe pueblos, thick walls slow down temperature changes. This helps keep the inside temperature steady.
Small openings help control heat gain and loss. Shared walls also protect against wind and sun.
Building up instead of out is smart. Stacked rooms create shaded areas and stable temperatures all day.
Plains and Plateau earth lodges and seasonal strategies
On the Plains and Plateau, earth lodges were built with timber frames and soil layers. This helped keep out wind and hold warmth.
These lodges were built to move with the seasons. People followed the food and fuel cycles, not a calendar.
Entrances were low and layouts were compact. This helped manage drafts in open areas where wind was always strong.
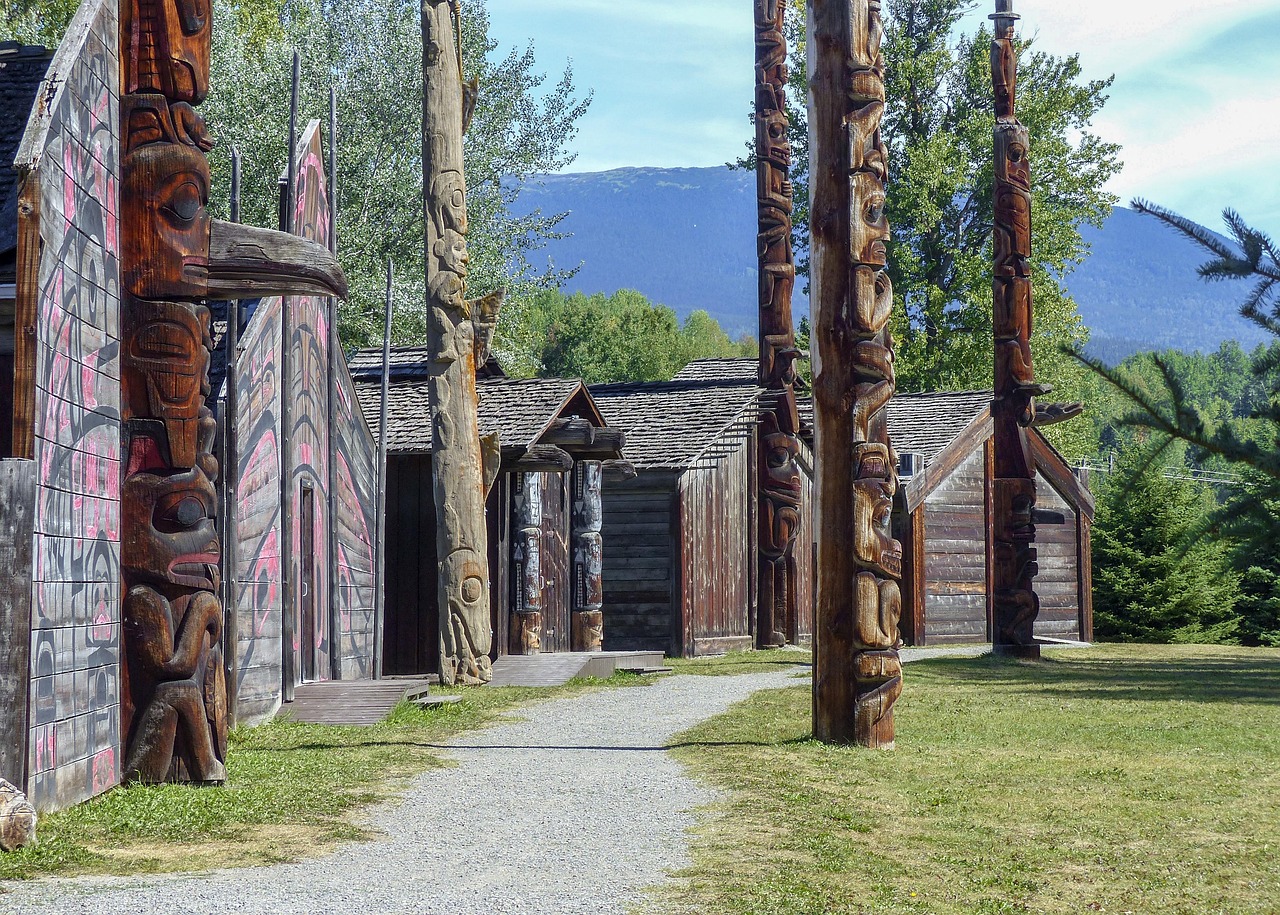
Pacific Northwest plank houses and rain-ready design
In the Pacific Northwest, plank houses were built with lots of timber and big interiors. They were made for long, wet seasons.
Steep roofs and raised floors kept water out. Rain-screen traditions were used in the design to manage water.
Wood was chosen for its durability. It could shed moisture and dry out, unlike other materials.
Arctic and Subarctic snow and sod structures for insulation
Farther north, buildings were designed for survival. They had less surface area and fewer leaks to lose heat.
Snow shelters and earth-sheltered forms kept heat in. Insulation with sod was used when timber was scarce.
| Region | Primary form | Key materials | Climate pressure addressed | Built-in performance tactic |
|---|---|---|---|---|
| Southwest | Southwest adobe pueblos | Adobe, clay plaster, local stone | Hot days, cool nights, intense sun | Thermal mass walls; small openings; shared, clustered massing |
| Plains & Plateau | Earthen lodges | Timber frame, earth cover, grasses | High winds and winter cold | Earth-sheltering; low profile; insulated roof layers |
| Pacific Northwest | Plank houses | Cedar planks, heavy beams, bark fibers | Persistent rain and humidity | Steep roofs; raised edges; rain-screen traditions for drainage and drying |
| Arctic & Subarctic | Snow and sod structures | Snow, sod, earth, limited wood | Extreme cold and heat loss risk | Compact volume; reduced openings; insulation with sod to seal and buffer |

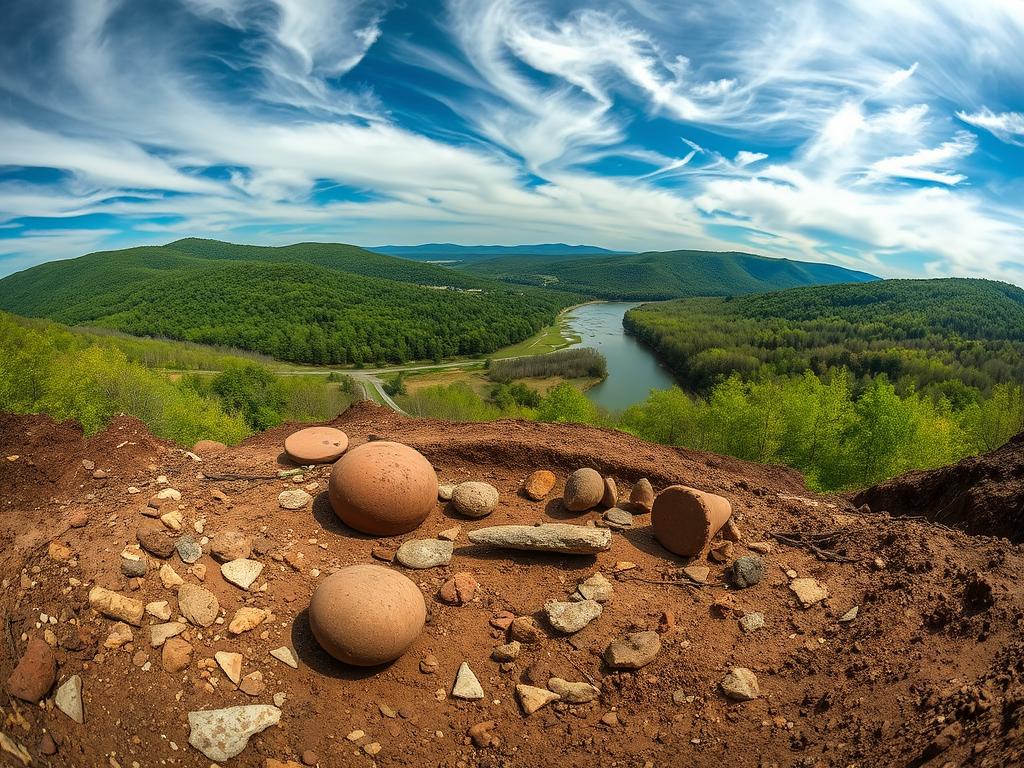
Site Selection and Landscape Integration
In many Indigenous traditions, picking a site was not about a pretty view. It was about avoiding harsh weather. Builders looked at slope, soil, and shade like we read reports today. Landscape integration was a practical choice, not just for looks.
Designing for microclimates started with the sun. Winter sun is free and always there. South-facing slopes extended daylight warmth. Trees and shadows kept summer heat away.
Wind sheltering was simple yet effective. A hill, trees, or rocks could block wind without needing upkeep. Homes were placed where breezes could cool in summer but not freeze in winter.
Access to water was key, but it came with a risk of floods. Settlements were near water but also on higher ground. This kept homes safe from heavy rains.
The land was like a type of infrastructure. Berms, plants, and natural shapes guided water and kept temperatures steady. This approach disturbed the land as little as possible while meeting needs.
Landscape Integration processes
- Terrain cues helped find where cold air settled and where sun hit first.
- Resource proximity cut down on waste and unnecessary roads.
- Patterned placement spread out risks and made access better over time.
Today, we use tools like solar studies and wind roses to understand what the land says. This approach is not just about looking back. It’s about respecting the land’s wisdom before we build on it.
| Site factor | Observed Indigenous approach | Modern analysis equivalent | Performance benefit |
|---|---|---|---|
| Sun path | Preference for south-facing exposure and controlled shade | Solar orientation study with seasonal shading review | More winter warmth; less summer overheating |
| Wind and storms | Use of landforms and vegetation for wind sheltering | Wind rose + setback modeling + storm tracking | Lower heat loss; calmer outdoor work areas |
| Water and drainage | Near water sources, but with flood-aware placement | Watershed mapping + floodplain and runoff modeling | Reliable access; reduced flood and erosion risk |
| Soil and ground stability | Building on firm ground with predictable drainage | Geotechnical review + infiltration and slope checks | Fewer cracks and settlement issues; better moisture control |
| Habitat impact | Minimize disturbance to support ecological fit over time | Site disturbance limits + habitat assessment | Healthier soils; stronger long-term resilience |
| Movement and access | Placement aligned with travel routes and shared resources | Circulation planning + service access evaluation | Less energy spent moving goods; smoother daily routines |
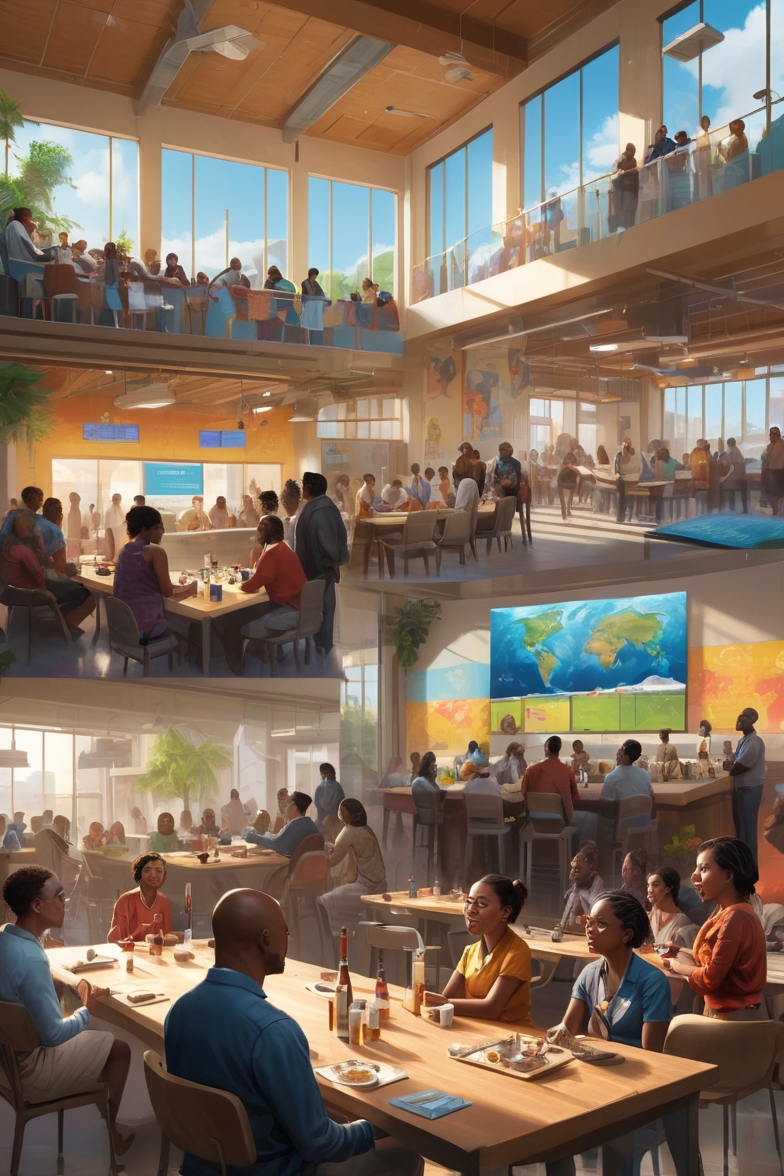
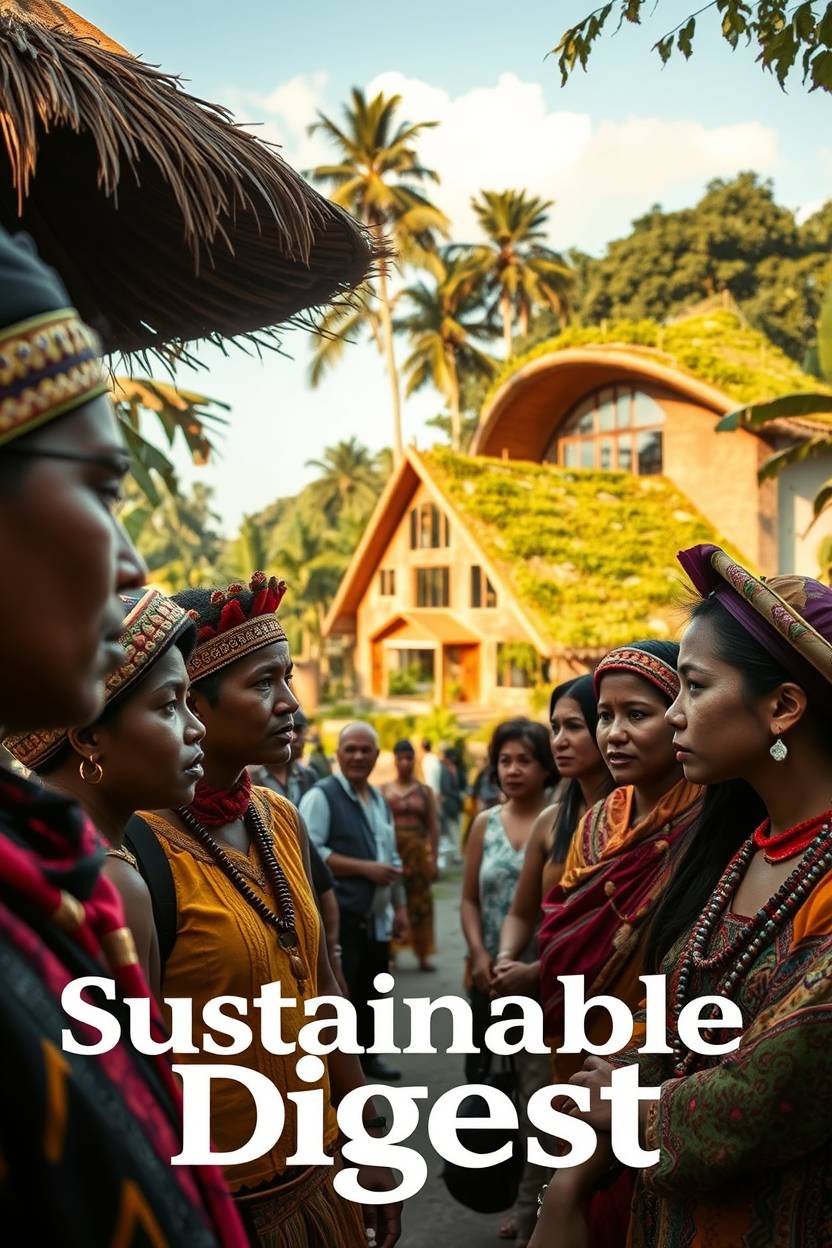
Community-Centered Design, Cultural Continuity, and Stewardship

In many Indigenous building traditions, sustainability was more than just a list of materials. It was a way of life. Buildings were tied to family, place, and work, carrying culture through generations. Decisions were made with care, resources were gathered wisely, and everyone was responsible when weather tested the walls.
Building as a communal process and knowledge transfer
Building together was like building social bonds. People worked, learned, and passed on skills as they went. Tasks were shared, so everyone knew how to fix things when needed.
This way of building taught patience and respect for nature. Materials were chosen based on the season, fitting the climate and terrain. This approach became part of their culture, not just a building phase.
Respecting sacred landscapes and cultural protocols
Where a home sits can hold deep meaning. Indigenous protocols guide what and where to build, to avoid disturbing sacred places. Modern designers must respect these rules, getting consent and understanding sovereignty.
This respect is key to stewardship ethics. It’s about who decides, who benefits, and who takes the risk. It’s not just about following rules, but about understanding the land and its people.
Longevity through maintenance traditions and shared responsibility
Long-lasting homes need regular care, not just repairs. Traditional practices keep homes healthy and strong. Modern promises of “maintenance-free” often mean higher costs and harder fixes.
| Practice focus | Community approach | What it supports over time |
|---|---|---|
| Routine inspections after storms | Shared checklists and quick fixes during seasonal gatherings | Early detection of moisture, settling, and wind damage |
| Surface renewal (plaster, limewash, clay) | Local mixes adjusted to humidity, sun, and wall behavior | Moisture control, breathability, and easier repair cycles |
| Sacrificial components | Replaceable layers designed to wear out first | Protection of structural members and reduced material waste |
| Responsibility and governance | Clear norms for who maintains what and when | Continuity of care; fewer deferred repairs and failures |

Durability is a shared effort, not just a product claim. Community design and communal building make this effort clear. Traditional maintenance and stewardship ethics keep it going strong. Together, they build a lasting legacy that goes beyond trends.
Water Wisdom: Harvesting, Drainage, and Resilience
In many Indigenous settlements, water planning was a top priority. This was because having water to drink was essential. The way water was managed showed a deep understanding of how to handle water effectively.
Rainwater collection concepts in traditional settlements
Rainwater harvesting was key in these communities. Roofs, courtyards, and footpaths directed water to storage areas. This approach reduced the need for a single water source.
Conservation was a big part of this system. It helped manage water use without wasting it. This careful approach shaped daily life, from water carrying to rationing.
Managing runoff, erosion, and flood risk with landform cues
Managing runoff was like reading the weather. Communities avoided floodplains and used terraces to control water flow. This kept homes safe from water damage.
Today, this approach is still important. It helps buildings withstand heavy rain and dry spells. Proper roof edges and grading are crucial for keeping foundations safe.
Material choices that support moisture resilience
Earthen buildings lasted long with the right care. Moisture management was key. Raised foundations and overhangs protected walls from water damage.
Modern practices follow similar principles. Good drainage and durable finishes are essential. This approach helps buildings last longer and withstand harsh weather.
| Water challenge | Traditional response | Comparable modern practice in the United States | What it protects |
|---|---|---|---|
| Short, intense rainfall | Directed roof runoff to safe paths; kept wall bases dry through overhangs | Graded swales, downspout routing, and distributed infiltration | Foundations and earthen wall protection |
| Seasonal scarcity and drought | Rainwater harvesting with storage; careful household conservation | Cisterns, demand management, and drought planning | Reliable daily supply |
| Slope-driven washouts | Terraces, berms, and planted edges for erosion control | Check dams, vegetated buffers, and slope stabilization | Topsoil and access routes |
| Water at wall base | Sacrificial plasters; raised plinths; breathable finishes for moisture detailing | Capillary breaks, lime-based renders, and repairable claddings | Wall strength and indoor comfort |
| Overflow during storms | Clear drainage corridors; avoided natural low points for flood-resilient design | Floodplain avoidance, freeboard, and overflow routing | Living space and critical utilities |

Comparing Traditional Indigenous Buildings and Modern Earthships
When we look at traditional Indigenous buildings and earthships, we see a big difference in purpose. Indigenous homes were built for community and shared work. Earthships, on the other hand, focus on individual freedom and avoiding utility bills.
Materials also play a key role in this comparison. Traditional buildings used natural materials like soil and wood. Earthships, while using natural materials, also include items like tires and bottles, making them more complex.
Systems thinking is another area where earthships and traditional buildings differ. Earthships can be very efficient in the right climate, especially with a well-designed greenhouse. But, they can also struggle with moisture and overheating, unlike traditional buildings that were often tested over time.
Traditional vs. Modern sustainable dwelling
| Comparison lens | Traditional Indigenous buildings | Modern earthships |
|---|---|---|
| Primary purpose | Community continuity, shared skills, seasonal rhythms, and long-term stewardship | Off-grid experimentation, household autonomy, and integrated systems under one roof |
| Typical material profile | Biogenic and earthen materials; minimal processing and straightforward repair | Hybrid salvage plus industrial inputs (tires, bottles, concrete, liners); detailing is more technical |
| Operational strategy | Seasonal operation and climate-tuned form; comfort managed with habits and architecture | Indoor climate managed through mass, glazing, and water/air systems; earthship performance varies by region |
| Embodied impact | Lower embodied carbon in many cases; simpler end-of-life pathways and reuse | Potential landfill reduction; embodied carbon can rise with cement and specialized components |
| Regulatory and health friction | Often compatible with natural-material codes when properly engineered | Permitting can be harder; tire walls and airtight zones can raise air-quality and inspection concerns |
| Design meaning | Strong cultural context in architecture; forms reflect place, identity, and protocol | Aesthetic is often mistaken for tradition; borrowing principles differs from borrowing identity |
It’s important to understand the cultural context of architecture. Climate design can be universal, but cultural symbols should not be used lightly. This is because cultural context in architecture is not just about looks.
For those planning and building, the choice between traditional and earthship homes is not easy. Simple designs are often easier to maintain, but earthships offer a unique challenge. Even a well-designed greenhouse can be a blessing or a curse, depending on how it’s built and the climate.

Design Takeaways for Sustainable Homebuilding Today
Building homes sustainably is simpler when we first ask: what does this site demand? Designing for the climate starts with understanding the sun, wind, rain, and soil. Using materials that fit the site is key, even if they seem natural.
When deciding between thermal mass and insulation, form is as important as material. A deep porch can be as effective as any technology in hot weather. It’s all about how well the design fits the climate.
The choice between thermal mass and insulation is a puzzle. Heavy walls can keep temperatures steady, but only if they’re right for the site. Insulation cuts energy use, but can trap moisture if not designed to dry.
Ventilation
A good ventilation strategy is crucial for air quality and moisture control. Even the smallest duct or vent can do the most important work.
Design teams should work together, not against each other. Using operable windows and heat pumps can reduce energy needs. The best design is like a weather forecast, guiding how the house interacts with the environment.
Ethical building strategies
Ethical design means more than just inspiration. It’s about respect and responsibility. Using Indigenous wisdom is valuable, but it must be done with care and consent.
In the U.S., building codes and insurers set the rules. A smart approach includes small tests and clear documentation. Understanding soil and moisture behavior is essential, no matter how beautiful the designs.
| Decision point | Common option | What to check early | Why it matters in the U.S. |
|---|---|---|---|
| Form and orientation | Compact massing with tuned glazing | Overhang depth, summer shading, winter solar access | Supports climate-appropriate design across hot-arid, cold, and mixed-humid zones |
| Wall assembly | High mass wall, insulated frame, or hybrid | Thermal mass vs insulation balance; drying potential; dew-point risk | Reduces comfort swings and moisture damage without overbuilding |
| Fresh air and moisture | Natural + mechanical ventilation | Ventilation strategy, filtration needs, exhaust locations, makeup air | Improves indoor air quality and helps control humidity during wildfire smoke and humid summers |
| Permitting pathway | Prototype wall, lab tests, early plan review | Building codes earthen homes, engineering sign-off, insurer requirements | Prevents redesign late in the process, when budgets become “historical artifacts” |
| Reference and storytelling | Learning from Indigenous precedents | Attribution, consent, avoiding sacred motifs, fair compensation | Keeps ethical design inspiration grounded in respect and real accountability |
- Prototype first: build a small wall or shed to observe drying, cracking, and detailing before scaling up.
- Test what is local: confirm soil performance and stabilizer needs rather than trusting assumptions about “natural.”
- Meet reviewers early: a short conversation can surface code paths, required reports, and inspection expectations.

Conclusion
This summary shows a key truth: many Indigenous buildings in the United States were made for the climate, not just for looks. They used the sun, wind, and shade wisely. Their walls were made from local materials and controlled moisture well.
Waste was low because they focused on fixing, reusing, and seasonal care. This approach made their buildings last long.
The lessons from Indigenous architecture teach us about care, not just warranties. Earth-friendly homes work best when they see maintenance as part of life. These sustainable design principles are seen in small details that prove their worth in storms.
Earthships and cob houses can be good choices if they fit the site and handle local weather. But, Indigenous architecture is more than just a style. It’s about the land, community, and freedom.
When we borrow Indigenous designs without understanding their context, we harm. This turns design into a form of taking without giving back.
The main lesson for building homes in the United States is to learn from the site. Respect its limits and design for repair from the start. Sustainability is about building a relationship with the land, not just adding features.
Build homes that last as long as the landscape, because they will. This approach is not just practical but also respectful of the environment.
Key Takeaways
- proto-sustainability helps explain why many Indigenous architecture systems perform so well in local climates.
- ancient housing often relied on thermal mass, passive solar gains, and smart airflow instead of mechanical systems.
- sustainable building history looks different when vernacular design is treated as engineering, not folklore.
- climate-responsive homes share principles across regions, but details change with weather, soils, and available fibers.
- United States traditional buildings can inform modern practice without copying cultural meaning or sacred forms.
- earthships and cob houses echo older strategies, yet diverge through industrial materials and code-driven constraints.