
November 2025 is set to be a month of big environmental and cultural focus. Global Entrepreneurship Week and National Recycling Week will be key. Around the world, many holidays and observances will stress the need for sustainability.
From Antigua’s Independence Day to Cambodia’s, and All Saints’ Day, the month is packed with different traditions. These events not only celebrate rich cultures but also encourage us to think about sustainable practices.
As we mark these important days, there’s a push to make eco-friendly living a part of our daily lives. It’s a chance to reflect and make a positive change.

The Global Tapestry of November Celebrations
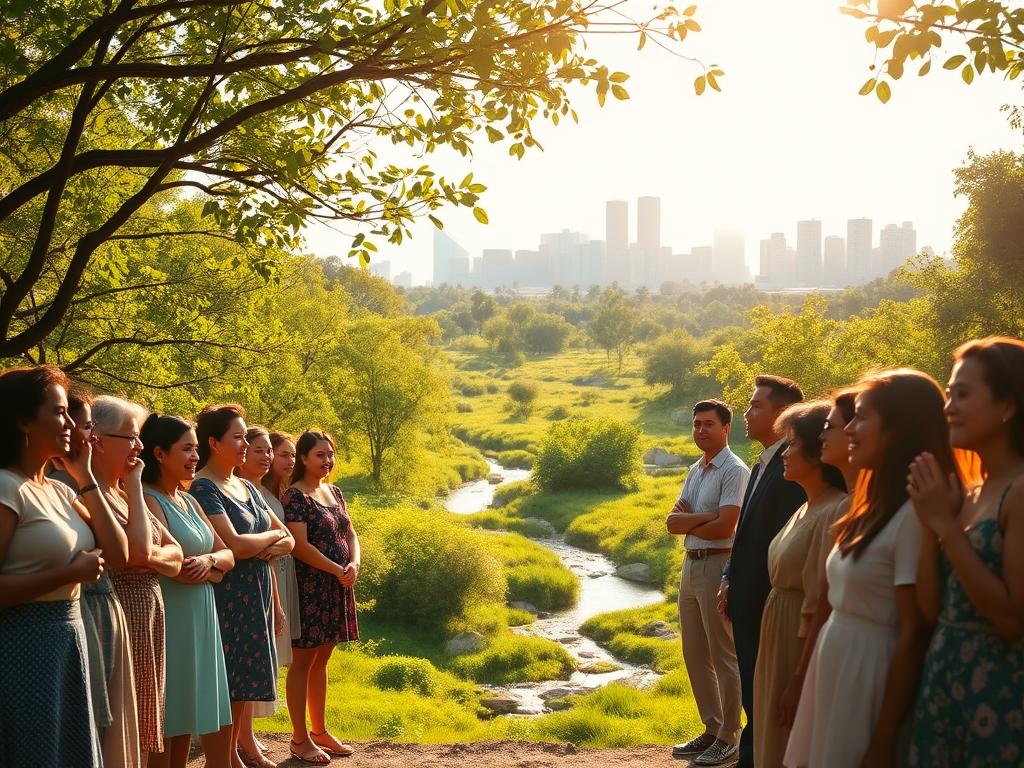
November is filled with celebrations from around the world. These events show the diversity of cultures and the connections between people. They highlight the richness of human experiences and our global unity.
Cultural Significance of November Observances
November is a month of great cultural importance. It is filled with celebrations that reflect the history and traditions of different societies.
Diversity of Global Celebrations
The variety of November celebrations shows our world’s multicultural nature. Events like Diwali in India and Thanksgiving in the United States each hold unique cultural meanings.
Historical Context of November Holidays
Many November holidays have deep historical roots. For example, All Saints’ Day and All Souls’ Day come from Christian traditions. Bonfire Night remembers a key event in the UK.
Sustainability as a Lens for Traditional Celebrations
As we focus more on the environment, we’re looking at old celebrations in a new way. This change helps reduce the environmental impact of our celebrations.
Evolving Practices for Environmental Consciousness
Celebrations are changing to be more eco-friendly. For instance, Diwali now uses eco-friendly materials, and Thanksgiving aims to reduce waste.
Balancing Tradition with Ecological Responsibility
It’s a challenge to keep traditions alive while being green. But, we can do it by using local materials, cutting down on energy, and choosing eco-friendly transport. This is especially true on World Sustainable Transport Day.
| Celebration | Traditional Practice | Sustainable Alternative |
|---|---|---|
| Diwali | Using non-biodegradable decorations | Using biodegradable or recycled materials for decorations |
| Thanksgiving | Excessive food waste | Planning meals, using up leftovers, and composting food waste |
| Bonfire Night | Using traditional fireworks | Opting for eco-friendly fireworks or alternative celebrations |
Independence Days Across Continents: Sustainable Commemorations

Countries around the world are now celebrating their independence in greener ways. As they mark their freedom, they’re also thinking about the planet. This shift shows a growing focus on eco-friendly celebrations.
Caribbean and Latin American Independence Celebrations
In the Caribbean and Latin America, independence days are filled with joy and pride. These events honor history and also encourage green practices.
Antigua, Dominican Republic, and Barbados Independence Days
Antigua, the Dominican Republic, and Barbados celebrate their freedom with great fanfare. Their November days highlight cultural traditions. By cutting down on plastic and supporting local crafts, these celebrations can be greener.
Revolution Day Mexico and Independence of Cuenca
Mexico’s Revolution Day and Ecuador’s Cuenca Independence on November 3rd are big deals. Adding eco-friendly touches like energy-saving lights and green decorations can make these events better for the environment.

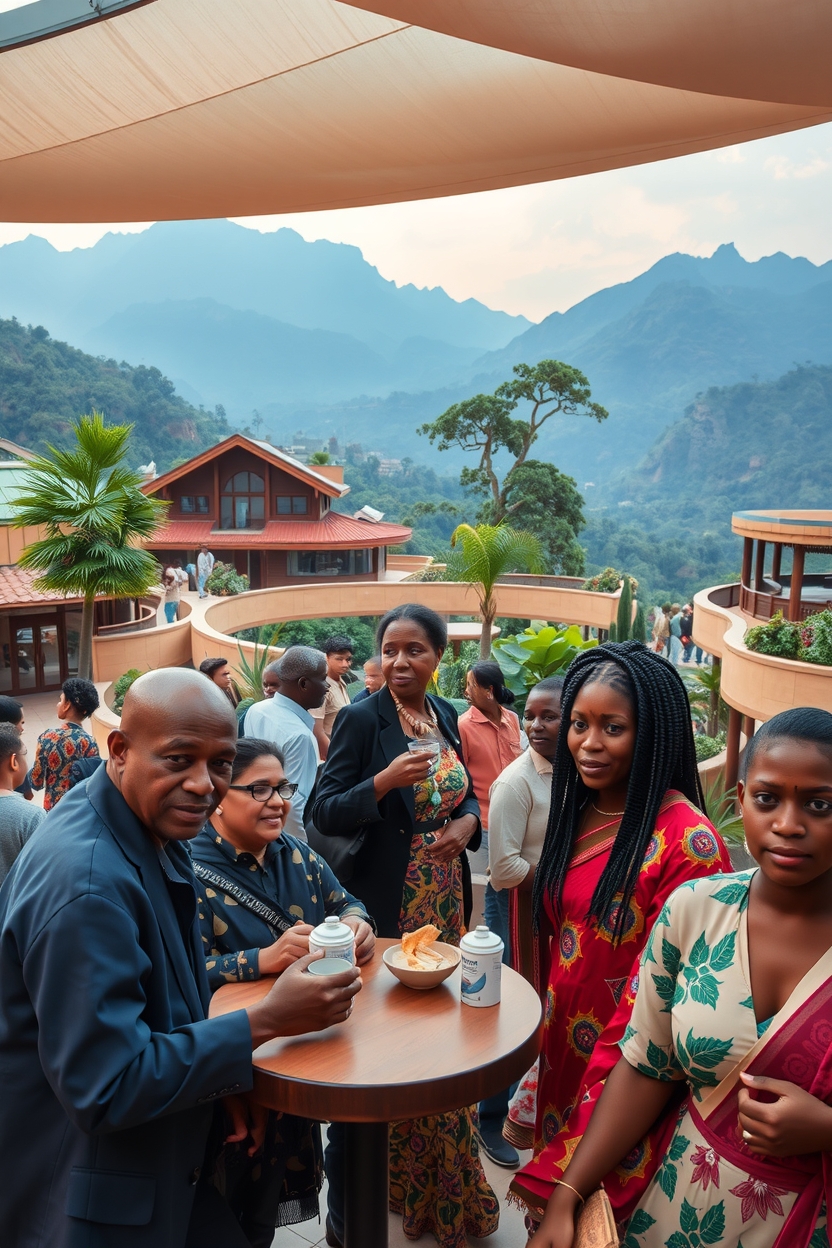
African and Asian Nations’ Sovereignty Observances
African and Asian countries also celebrate their freedom with passion. These events are a chance to blend tradition with sustainability.
Angola, Mauritania, and Cambodia Independence Days
Angola, Mauritania, and Cambodia mark their freedom with cultural festivities. Using digital invites and local materials can help reduce waste and carbon emissions.
Lebanon Independence Day and Bosnia & Herzegovina National Day
Lebanon and Bosnia & Herzegovina celebrate their freedom with joy. By choosing eco-friendly fireworks and decorations, they can make their celebrations more sustainable.
Eco-Friendly National Celebrations
As countries celebrate their freedom, they’re making a conscious effort to be kinder to the planet. This includes cutting down on waste and finding green alternatives to old traditions.
Reducing Carbon Footprint of Public Events
Public events during independence celebrations can be made greener. Using energy-efficient tools and encouraging people to travel together or by bike can help.
Sustainable Alternatives to Fireworks and Decorations
There are many sustainable alternatives to fireworks and decorations. Drone shows and decorations made from biodegradable or recycled materials can make celebrations more eco-friendly.

Festival of Lights: Diwali and Sustainable Practices
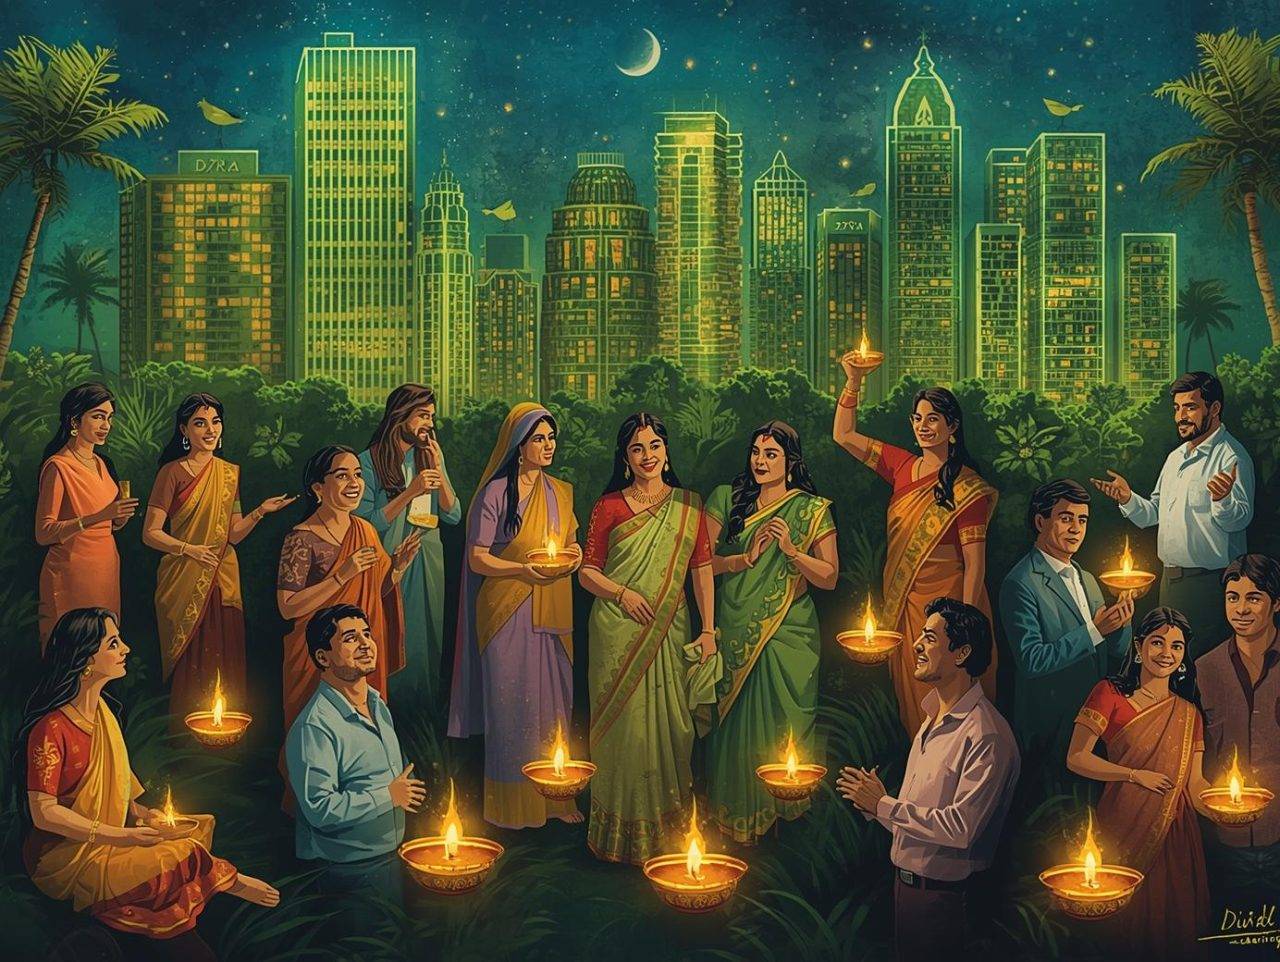
Diwali, a festival deeply rooted in Hindu tradition, is being reimagined with eco-friendly practices. This is to reduce its environmental footprint. As we celebrate the triumph of light over darkness, it’s crucial to think about our impact on the planet.
Diwali Celebrations Around the World
Diwali is celebrated with great fervor across the globe. Different cultures add their unique twist to the traditional practices. It’s a time for family gatherings, feasting, and illuminating homes with diyas and lights.
Lakshmi Puja and Naraka Chaturdashi Traditions
Lakshmi Puja is a significant part of Diwali celebrations. It involves worshiping Goddess Lakshmi for prosperity and good fortune. Naraka Chaturdashi marks the victory of Lord Krishna over the demon Narakasura.
Kali Puja and Govardhan Puja Observances
In some regions, Diwali is associated with Kali Puja, honoring Goddess Kali. Govardhan Puja is celebrated to commemorate Lord Krishna’s lifting of the Govardhan Hill. This symbolizes the importance of nature and conservation.
Eco-Friendly Alternatives to Traditional Celebrations
As Diwali celebrations evolve, there’s a growing shift towards eco-friendly practices. Some of these include:
- Using LED lights, which consume less energy and last longer than traditional bulbs.
- Opting for sustainable decorations that can be reused or recycled.
LED Lights and Sustainable Decorations
LED lights are not only energy-efficient but also reduce carbon emissions. Sustainable decorations, such as those made from natural materials or recycled products, add to the festive ambiance while minimizing waste.
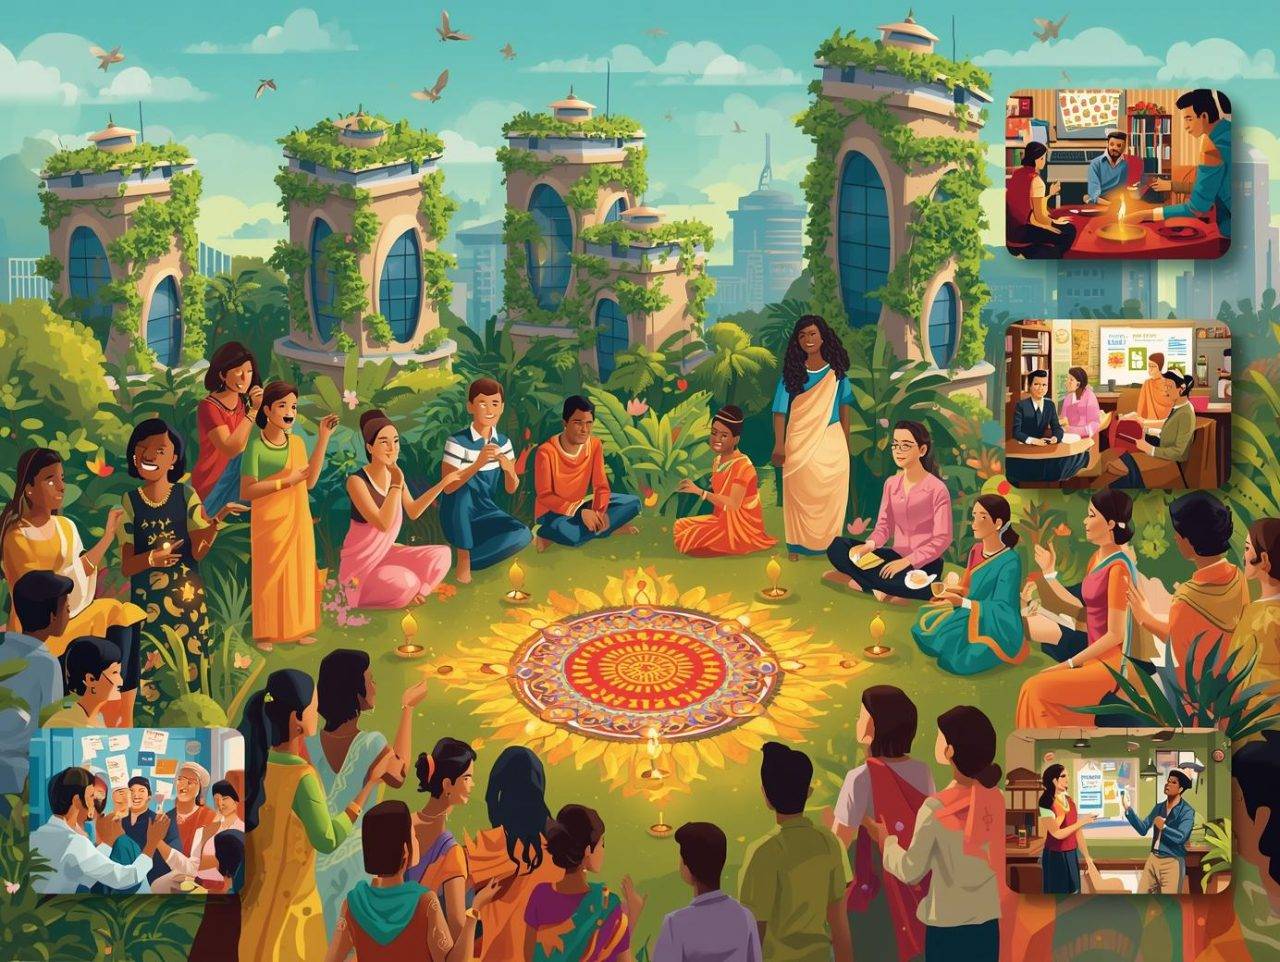
Non-Toxic Colors and Eco-Friendly Rangoli
The use of non-toxic colors and eco-friendly materials for Rangoli designs is becoming increasingly popular. This reduces the environmental impact of traditional Diwali celebrations.
Community Initiatives for Sustainable Diwali
Communities are playing a vital role in promoting sustainable Diwali practices through various initiatives.
Noise and Air Pollution Reduction Campaigns
Campaigns aimed at reducing noise and air pollution during Diwali are gaining momentum. They encourage the use of eco-friendly fireworks and limit firecracker usage.
Waste Management Strategies for Festivals
Effective waste management strategies are being implemented to handle the increased waste generated during Diwali. This includes recycling programs and proper disposal methods.
Indigenous and Cultural Heritage Observances

November is a time to remember the importance of keeping indigenous cultures alive. It’s a month filled with celebrations that honor the traditions and contributions of indigenous communities around the world.
National Native American Heritage Month
In the United States, November is National Native American Heritage Month. It’s a time to recognize the rich cultural diversity and historical significance of Native American communities. This month is key for promoting understanding and appreciation of indigenous cultures.
Honoring Indigenous Ecological Knowledge
Native American communities have traditional ecological knowledge that’s crucial for sustainable environmental practices. Their understanding of nature and conservation methods offer valuable insights into managing natural resources effectively.
Sustainable Practices from Native American Traditions
Many Native American traditions focus on living in harmony with nature. For example, “mitakuye oyasin,” or “we are all related,” shows the interconnectedness of all living beings. It encourages sustainable practices.
Regional Cultural Celebrations
Besides National Native American Heritage Month, November also hosts various regional cultural celebrations. These events showcase the unique cultural identities of different communities.
Kannada Rajyothsava and Karnataka Cultural Identity
In India, Karnataka celebrates Kannada Rajyothsava on November 1st. This day commemorates the formation of the state. It’s marked by cultural events that highlight the region’s rich heritage.
Kut Festival and Kamehameha I’s Birthday Observances
The Kut Festival, celebrated in some parts of India, and the observance of Kamehameha I’s birthday in Hawaii, are examples of regional cultural celebrations in November. These events honor historical figures and cultural traditions.
Preserving Heritage Through Sustainable Practices
It’s vital to preserve cultural heritage while adopting sustainable practices. This ensures the long-term conservation of indigenous cultures. Various means, like using sustainable materials in traditional crafts and promoting eco-friendly cultural tourism, can help achieve this.
Traditional Crafts and Sustainable Materials
Using sustainable materials in traditional crafts preserves cultural heritage and supports environmental conservation. Artisans are increasingly adopting eco-friendly materials and practices.
Cultural Tourism and Environmental Conservation
Cultural tourism, when managed sustainably, can support the conservation of cultural heritage sites and promote environmental stewardship. It’s essential to balance tourism with conservation efforts.
| Cultural Celebration | Date | Significance |
|---|---|---|
| National Native American Heritage Month | November | Honors Native American cultures and contributions |
| Kannada Rajyothsava | November 1st | Celebrates the formation of Karnataka state |
| Kamehameha I’s Birthday | June 11th (sometimes observed in November in some contexts) | Honors the historical figure Kamehameha I |

Religious Observances and Eco-Spirituality
The month of November is filled with religious events that show a deep link between faith and caring for the Earth. These events offer chances for spiritual growth and taking care of our planet.
All Saints Day and All Souls Day Traditions
All Saints Day and All Souls Day are important in many Christian traditions. They honor the dead and pray for their souls. Now, there’s a shift towards more eco-friendly ways to celebrate.
Day of the Dead Celebrations and Sustainability
The Day of the Dead is celebrated in some Latin American cultures. It blends indigenous and Catholic traditions. People use local materials and eco-friendly decorations to celebrate.
Eco-Friendly Memorial Practices
There’s a growing trend towards eco-friendly ways to remember loved ones. This includes biodegradable decorations and sustainable funeral services. It’s a way to honor them while being kind to the Earth.
Eastern Religious Celebrations
Eastern religions also highlight the importance of caring for the Earth. Celebrations like Sage Nanak Jayanti in Sikhism and Hindu festivals show the link between faith and the environment.
The Enlightened Sage Nanak Jayanti and Sustainable Langar
Sage Nanak Jayanti is celebrated with langar, community kitchens serving vegetarian meals. Many gurdwaras are now using sustainable practices, like reducing food waste and eco-friendly servingware.
Sigd Day and Chhath Puja Eco-Practices
Events like Sigd Day in Ethiopian Orthodox tradition and Chhath Puja in Hinduism encourage eco-friendly actions. For example, using natural materials and saving water during rituals.
Spiritual Connections to Environmental Stewardship
Many religions teach the importance of taking care of the Earth. Faith-based environmental projects are becoming more common. Religious groups are leading in sustainability and conservation efforts.
Faith-Based Environmental Initiatives
Faith-based environmental projects aim to reduce waste and conserve resources. They promote eco-friendly practices within religious communities. These efforts are driven by spiritual values and a sense of responsibility.
Religious Communities Leading Sustainability Efforts
Religious groups are now at the forefront of sustainability. They have green roofs and community gardens. These projects show the strong bond between faith and caring for the Earth.
November 2025 Holidays Observances in Retrospect of Sustainability: Global Impact

The global impact of November 2025 holidays on sustainability is complex. The world celebrates many cultural, religious, and national events. These celebrations have a big environmental footprint.
Carbon Footprint Analysis of Global Celebrations
An in-depth look at November’s global celebrations shows key concerns. Massive energy use and travel are major contributors to the carbon footprint.
Energy Consumption During Holiday Seasons
Energy use goes up during holidays with more lighting and heating. LED lights can cut energy use by up to 75% compared to old bulbs.
Travel and Transportation Environmental Impacts
Holiday travel and transport lead to more greenhouse gas emissions. Eco-friendly transportation options like electric or hybrid cars help reduce this.
Sustainable Transformation of Traditional Practices
Changing traditional practices to be more sustainable is key. This can happen through policy changes, government efforts, and global cooperation.
Policy Changes and Government Initiatives
Governments can support sustainable holiday practices. They can offer benefits for using renewable energy.
International Cooperation for Sustainable Celebrations
Working together internationally is crucial. It helps share best practices and set global standards for green celebrations.
Case Studies of Eco-Friendly Holiday Initiatives
Many places have started eco-friendly holiday projects. These examples show how to lessen environmental harm.
Success Stories from Different Regions
Scandinavia leads in eco-friendly Christmas markets. They use sustainable materials and energy-saving lights.
Measuring and Reporting Sustainability Improvements
It’s important to track and share how green initiatives are doing. Regular checks and clear reports help see progress.
Environmental Awareness Observances in November
November is a key month for environmental awareness. It’s filled with observances that focus on important environmental issues. These efforts aim to promote sustainability and encourage conservation worldwide.
Wildlife Conservation Awareness Events
November sees several events for wildlife conservation. These events highlight endangered species and their habitats. They are essential for educating people and boosting conservation efforts.
Manatee Awareness Month Initiatives
November is Manatee Awareness Month. It’s dedicated to protecting these gentle creatures and their homes. Educational programs, habitat restoration, and advocacy for manatee conservation are key initiatives.
Polar Bear Week and Climate Change Education
Polar Bear Week in November focuses on climate change’s impact on polar bears. Educational programs and campaigns aim to raise awareness about the need for climate action.
Sustainability-Focused Observances
November also features several sustainability observances. These events promote eco-friendly practices and sustainable living. They encourage individuals and organizations to adopt environmentally responsible behaviors.
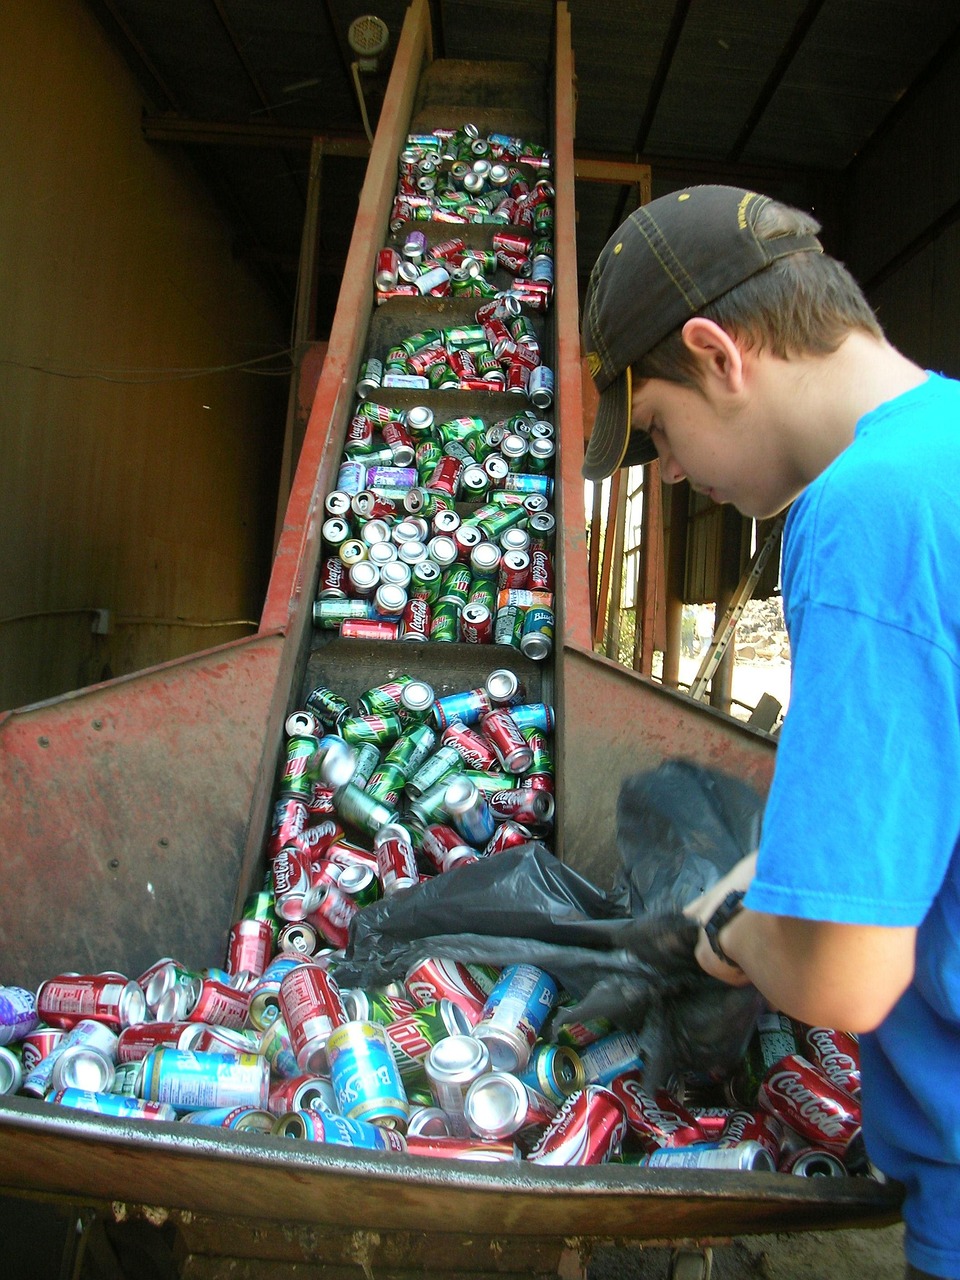
National Recycling Week Programs
National Recycling Week in November encourages recycling and waste reduction. It includes community recycling drives, educational workshops, and campaigns to cut down on waste.
World Sustainable Transport Day Innovations
World Sustainable Transport Day highlights the need for green transport solutions. It showcases innovations in electric vehicles, public transport, and non-motorized transport. These efforts aim to create a greener future for travel.

Grassroots Movements and Corporate Sustainability
Grassroots movements and corporate entities are crucial for environmental sustainability. Their efforts and commitments are key to driving change.
Community-Led Environmental Campaigns
Community-led campaigns mobilize local communities to address environmental issues. They often focus on local concerns like pollution, deforestation, or wildlife conservation.
Business Sector Sustainability Commitments
The business sector is making significant sustainability commitments. They include reducing carbon footprints, implementing sustainable supply chains, and promoting eco-friendly products.
Food and Agricultural Celebrations: Sustainable Gastronomy

November is filled with food and agricultural celebrations that focus on eco-friendly eating. These events celebrate local food traditions and the need for sustainable food systems.
Beverage and Food Festivals
November sees many beverage and food festivals worldwide. These festivals celebrate local food and traditions while encouraging sustainable eating.
Beaujolais Nouveau Day and Sustainable Viticulture
Beaujolais Nouveau Day, on the third Thursday of November, is a wine festival that supports sustainable viticulture. Winemakers use eco-friendly methods like organic farming and lower carbon footprints.
National Louisiana Day and Mississippi Day Culinary Traditions
National Louisiana Day and Mississippi Day celebrate the rich food traditions of these areas. They promote using sustainable seafood and local ingredients in traditional dishes.
Agricultural Fairs and Sustainable Farming
Agricultural fairs in November showcase sustainable farming. These events highlight eco-friendly farming methods and new farming techniques.
Pushkar Camel Fair Eco-Initiatives
The Pushkar Camel Fair has started eco-initiatives like waste management and sustainable livestock care. These efforts aim to lessen the fair’s environmental impact.
Sustainable Livestock Management Practices
Sustainable livestock management is key in farming today. Practices like rotational grazing and less antibiotic use are being used to make farming more sustainable.
| Celebration | Sustainable Practice | Impact |
|---|---|---|
| Beaujolais Nouveau Day | Organic viticulture | Reduced chemical use |
| Pushkar Camel Fair | Waste management | Reduced environmental impact |
| National Louisiana Day | Sustainable seafood | Promotes eco-friendly seafood practices |

Plant-Based Traditions and Dietary Sustainability
November also celebrates plant-based traditions and dietary sustainability. Events like World Vegan Day encourage eating plant-based.
World Vegan Day Impact and Growth
World Vegan Day has grown a lot, with more people choosing veganism. This growth helps reduce greenhouse gas emissions and improves animal welfare.
Traditional Plant-Based Celebrations Across Cultures
Many cultures have traditional plant-based celebrations. These events show the variety of plant-based food and encourage sustainable eating.
Economic and Social Sustainability in November Observances

November is filled with celebrations that show us the importance of economic and social sustainability. The world comes together to support entrepreneurship, inclusivity, and community service. These efforts are key to creating a better future for all.
Entrepreneurship and Sustainable Business
Entrepreneurship drives economic growth, and November is a big month for it. Global Entrepreneurship Week happens then, focusing on green business and sustainable practices.
Global Entrepreneurship Week Green Initiatives
During Global Entrepreneurship Week, we see new eco-friendly startups and sustainable business ideas. It encourages entrepreneurs to be green, helping our planet and economy.
Social Enterprise Day and Triple Bottom Line
Social Enterprise Day, part of Global Entrepreneurship Week, talks about the triple bottom line: people, planet, and profit. It shows that businesses can make money while helping society and the environment.

Inclusive Economic Observances
November also celebrates inclusive economic practices. Women Entrepreneurship Day and Africa Industrialization Day highlight the need for diverse and fair economic growth.
Women Entrepreneurship Day and Sustainable Leadership
Ideally, Women Entrepreneurship Day honors women in business and promotes sustainable leadership. It helps make the economy more fair and sustainable by empowering women.
Africa Industrialization Day and Green Manufacturing
Africa Industrialization Day focuses on green manufacturing and sustainable practices in Africa. It shows the balance between economic growth and protecting our environment.
Community Service and Social Sustainability
November is also about community service and social sustainability. Uniquely, National Philanthropy Day and Family Volunteer Day encourage people to help others and give back.
National Philanthropy Day Impact
National Philanthropy Day celebrates the good work of giving and volunteering. It promotes a culture of helping others and community service.
Family Volunteer Day Environmental Projects
Family Volunteer Day is about family projects that help the environment. It teaches young people about taking care of our planet and helping others.
| Observance | Date | Focus |
|---|---|---|
| Global Entrepreneurship Week | November 16-22 | Sustainable Business Practices |
| Women Entrepreneurship Day | November 19 | Women in Business |
| Africa Industrialization Day | November 20 | Green Manufacturing |
In conclusion, November’s events remind us of the importance of sustainability. By supporting entrepreneurship, inclusivity, and community service, we work towards a better world.

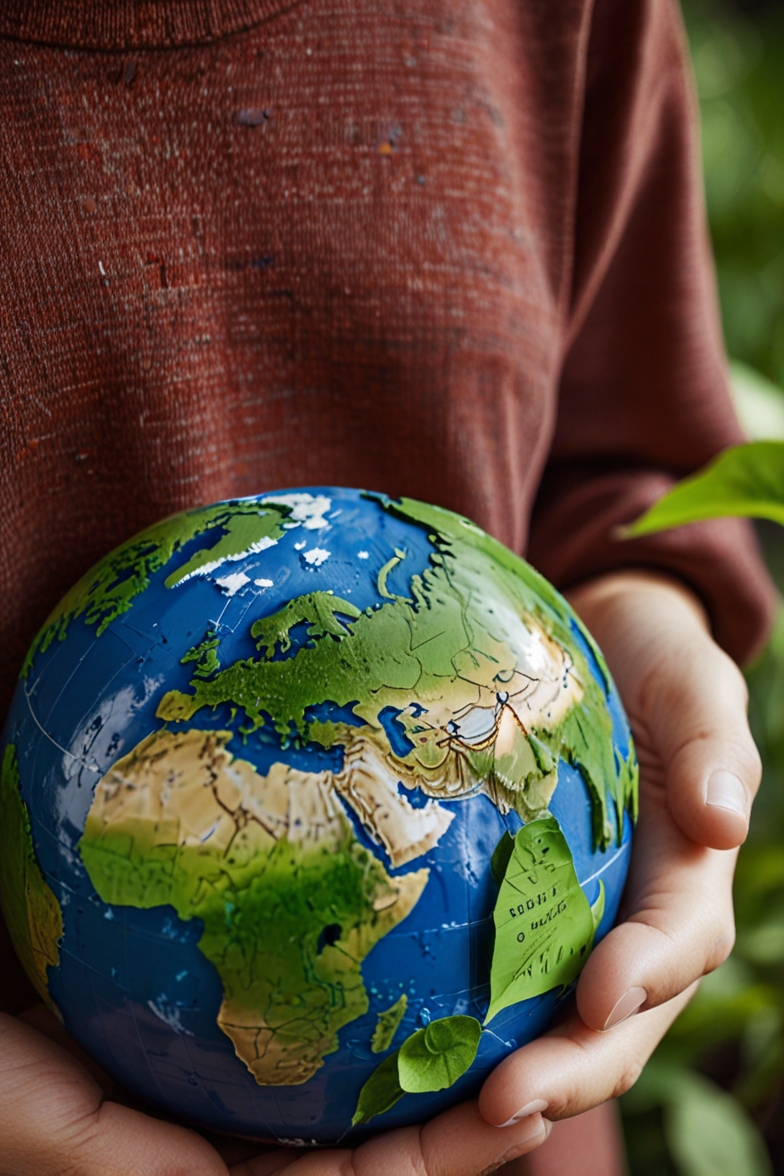
Conclusion: Embracing Sustainable Traditions for Future Generations
November holidays and observances are a chance to focus on the environment. Celebrations around the world show us the value of green traditions. They teach us to care for our planet.
By being eco-friendly, we cut down on waste and save resources. This makes our celebrations better for the Earth. It also keeps our cultural traditions alive.
Making our celebrations sustainable keeps them exciting for future generations. We can enjoy our cultural roots while protecting the environment. This way, we build a greener future together.
Thanks to our efforts, future generations will celebrate their heritage and care for the Earth. This is because we started using green practices in November’s holidays and observances.
Key Takeaways
- Diverse cultural celebrations in November 2025 promote sustainability.
- Global Entrepreneurship Week and National Recycling Week highlight eco-friendly practices.
- Antigua and Cambodia’s Independence Days showcase cultural heritage.
- All Saints’ Day encourages reflection on sustainable living.
- Sustainability is increasingly integrated into global observances.