
During Women’s History Month, we often celebrate pioneers who broke barriers. One such figure was a marine biologist whose eloquent writing changed how we see the natural world. Her journey in STEM, at a time when few women held such roles, makes her legacy particularly powerful.
She possessed a rare dual expertise. As a rigorous scientist and a gifted writer, she translated complex biology into stories everyone could understand. This skill turned ecological ideas into a mainstream concern.
Her most famous book, Silent Spring, questioned the unchecked use of chemicals. It framed environmental protection as a moral duty to future generations. The work did more than warn about dangers; it sparked a global movement.
Her experience within government, as an editor for the U.S. Fish and Wildlife Service, shaped her view. She believed firmly in the public’s right to know. This principle would later echo in the creation of agencies like the Environmental Protection Agency.
The central question remains: how do her warnings about chemical overreach prefigure today’s crises? Her story is one of intellectual courage against a powerful industrial complex. It provides an ethical blueprint for planetary stewardship that still guides us.
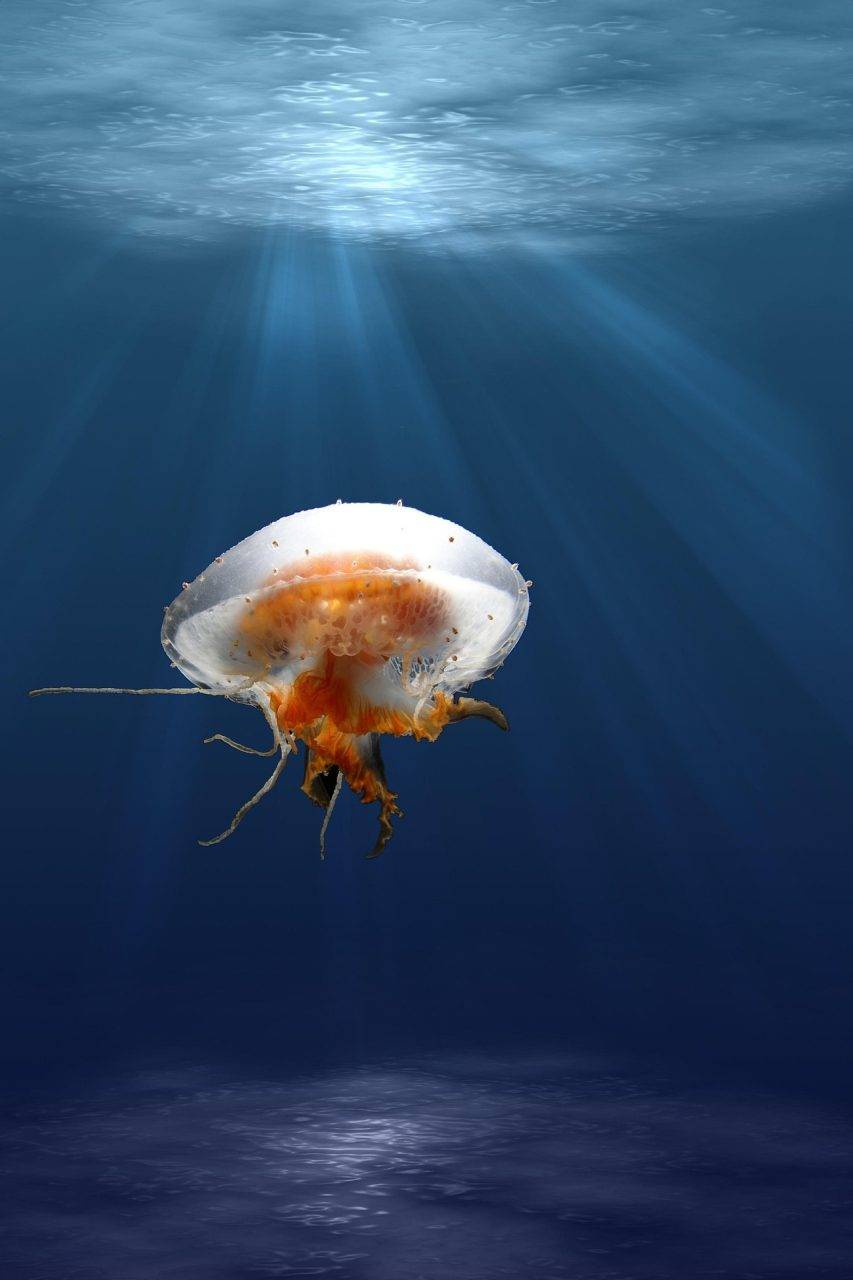
From Marine Biologist to Environmental Prophet
Rachel Carson started as a biodiversity conservation pioneer known for explaining science to everyone. Her books, like “The Sea Around Us,” made science interesting and accurate for all. She showed that science should be for everyone, not just experts.
Carson grew from focusing on oceans to understanding the whole planet. She saw how the ocean’s health reflects our planet’s. This broad view set her apart from others who focused only on parts of the environment.
Her work in marine biology led to new ideas about sustainability. She showed how pesticides harm ecosystems and build up in living things. Her knowledge helped her challenge the chemical industry’s claims.
The massive impact from Rachel Carson went beyond her books. She showed that scientists can serve the public while staying true to their work. Her example encouraged others to question the costs of progress and the safety of chemicals. She taught us that asking tough questions is the duty of scientists.
1. The Making of a Witness for Nature: Education and Early Career in a Changing World

In the shadow of Pittsburgh’s steel mills, a childhood spent exploring a family farm laid the groundwork for a revolutionary career in public science. Rachel Carson was born in 1907 in Springdale, Pennsylvania. Her family’s 65-acre plot near the Allegheny River was her first laboratory.
This pastoral landscape stood in stark contrast to the industrial behemoth nearby. That contrast between the organic and the mechanical would deeply inform her later life.
From Pennsylvania Woods to Marine Biology: A Foundation in Observation
Her early immersion fostered a powerful ethos of observation. By age ten, she had a story published in St. Nicholas magazine. This early literary success hinted at her future path.
At Pennsylvania College for Women, she initially studied English. In a pivotal move, she switched her major to biology. This fusion of literary skill and scientific rigor became her unique signature.

A 1929 summer fellowship at the U.S. Marine Laboratory in Woods Hole was transformative. It was her first sustained encounter with the sea. The experience cemented her academic direction.
She earned a scholarship to Johns Hopkins for graduate work. Her focus was marine zoology. This period built the authoritative foundation she would later use to communicate with the public.
Breaking Barriers: A Woman in the U.S. Fish and Wildlife Service
Her professional break came in 1935. The U.S. Bureau of Fisheries hired her part-time to write a radio series, “Romance Under the Waters.” Her talent for making science engaging was immediately apparent.
By 1936, she was appointed a junior aquatic biologist. She was one of only two women at a professional level in the agency. This was a significant barrier broken in federal government.
During World War II, her research skills were directed to a submarine detection program for the Navy. This work deepened her practical understanding of oceanography and federal priorities.
Promoted to aquatic biologist in 1943, she worked for the renamed U.S. Fish and Wildlife Service. She served as an editor and chief of publications. In this role, she authored public bulletins and the “Conservation in Action” series.
The irony was rich. Here was a woman excelling in a male-dominated agency. She was mastering the very system of public information she would later challenge.
Key Early Career Milestones of Rachel Carson
| Year | Milestone | Significance |
|---|---|---|
| 1929 | Fellowship at Woods Hole Marine Lab | First direct marine biology research; connection to the coast maine region. |
| 1935 | Hired by U.S. Fish & Wildlife precursor | Began professional science writing for the public. |
| 1936 | Appointed Junior Aquatic Biologist | Broke gender barriers in federal science. |
| 1943 | Promoted in Wildlife Service | Gained editorial control and bureaucratic insight. |

The Post-WWII Context: Science, Growth, and Unquestioned Progress
Carson’s early career unfolded against a specific historical backdrop. The post-war era was defined by unfettered economic growth and technological optimism. A “machine age” mentality viewed the natural world purely as a resource.
The Cold War and reconstruction efforts fueled a narrative of unquestioned progress. Conflicts like the Korean War reinforced a mindset of dominion. This was the dominant ethos during her time at the U.S. Fish Wildlife Service.
Globally, the 1950s and 60s saw decolonization and new nations gaining independence. Conflicts like the Vietnam War stirred international consciousness. A global audience for messages about planetary care was emerging.

Her insider view seeded a profound ecological caution. She saw the costs of industrial expansion. The impending crises of the 1970s—like the oil embargo—were prefigured in her early work.
This period forged her into a “witness for nature.” She gained scientific authority, literary skill, and an insider’s understanding of policy. These tools would soon be turned toward a critique of the very progress narrative she was immersed in.
Breaking Barriers in a Male-Dominated Scientific World
In the 1940s and 1950s, women in science faced big barriers. The Cold War pushed for more technology and chemicals, ignoring the risks. Yet, Carson’s work earned her respect from her male colleagues.
| Being a woman had its advantages and challenges: |
| Men often doubted her findings on chemical dangers |
| She worked outside the usual university power structure |
| Her writing reached more people than usual |
| Her fresh perspective allowed her to challenge the status quo |
| She could talk to a wider audience |
2. The Sea Trilogy: Laying the Ecological Foundation for a Public Audience

A trilogy of works about the sea, published between 1941 and 1955, performed a quiet revolution by making ecological science a mainstream literary genre. This series did more than describe marine life; it built a reservoir of public trust and wonder. That trust would prove essential for the more confrontational warnings to come.
Through these books, the biologist translated raw data into compelling narrative. She established ecology as a public science. The global hunger for this wisdom revealed a planet ready to think beyond national borders.
Under the Sea-Wind: Writing the Ocean’s Narrative
Her first major carson book, Under the Sea-Wind (1941), presented intricate science through poetic language. It followed the life cycles of a sea bird, a fish, and an eel. This narrative innovation personified marine creatures, making complex ecology relatable.
The work established her signature style. She blended rigorous research with the pacing of a story. This approach invited readers into the natural world, fostering empathy rather than just delivering facts.
The Sea Around Us: A Bestseller Brings Ocean Science to the World
The monumental success of The Sea Around Us (1951) was unprecedented. It topped the New York Times bestseller list for 81 weeks. Translated into 32 languages, its reach was truly global.
This sea around us phenomenon revealed a public hungry for planetary wisdom. Its focus on the ancient, timeless ocean offered a subtle critique of the era’s frantic, consumption-driven pace. The book’s international reception acted as a form of soft diplomacy, fostering shared wonder across Cold War divides.
The financial independence it provided was critical. Carson published the bestseller and resigned from government service in 1952. This marked her pivotal transition from federal scientist to independent public intellectual.
The Edge of the Sea: Exploring Ecosystems and Interconnectedness
The Edge of the Sea (1955) is a masterclass in interconnected thinking. It explored fragile coastal zones from the coast maine region to Florida. Carson detailed the precise interdependencies within tide pools and shorelines.
This work prefigured core principles of modern conservation biology. It presented an ecosystem as a web of relationships, not a collection of parts. Her observations included early notes on phenomena now central to the climate debate, like rising sea levels.
Her research for this volume utilized emerging post-WWII technologies. She blended findings from submarine studies with literary elegance. This demonstrated her commitment to cutting-edge science served with clarity.
The Sea Trilogy: A Foundational Project
| Year | Title | Core Innovation | Public Impact |
|---|---|---|---|
| 1941 | Under the Sea-Wind | Narrative personification of marine life | Established her lyrical, accessible writing style |
| 1951 | The Sea Around Us | Biography of the ocean as a geologic entity | Global bestseller; built massive public trust and credibility |
| 1955 | The Edge of the Sea | Ecosystem analysis of coastal zones | Taught ecosystem thinking to a broad audience |
The trilogy’s collective impact was profound. Rachel Carson first invited the world to marvel at the sea‘s wonders. This established her as its most trusted voice. That carefully earned credibility set the stage for her next, revolutionary act: revealing how that same world was being poisoned.
She built the foundation for public ecology in this time. The writing made the ocean‘s story everyone’s story. This global classroom prepared the ground for the urgent lessons that followed.
3. Silent Spring and the Awakening of Modern Environmentalism
The publication of Silent Spring in 1962 did not merely critique agricultural practices. It declared a profound philosophical war on the era’s core belief in technological infallibility. This carson book transformed a specialized scientific concern into a urgent national debate.
It argued that the widespread use of synthetic chemicals was an assault with unforeseen consequences. The work meticulously connected laboratory data to real-world dangers in backyards across America.
Connecting the Dots: From DDT to a “War Against Nature”
Rachel Carson wrote with forensic detail. She traced the journey of pesticides like DDT from crop dusters into the soil, water, and food chain. Her research demonstrated bioaccumulation, where toxins concentrate as they move up the ladder of life.
She linked these poisons to cancer and the thinning of bird eggshells. This was a clear indictment of an entire industry‘s practices. Her central thesis was that this was not progress, but a reckless conflict.
She called it an “uncontrolled lab experiment” on the American public.
Her methodology was formidable. With help from colleagues like Shirley Briggs, she compiled 55 pages of references. She synthesized entomology, oncology, and ecology into a single, damning narrative.
The Firestorm: Industry Backlash and Public Mobilization
The reaction from chemical companies was swift and severe. They mounted a coordinated smear campaign, spending over $250,000 to discredit her. They labeled her “frantic” and anti-science, a tactic meant to undermine her credibility.
What her critics did not know was her private battle. During this time, she was secretly fighting metastasizing breast cancer. She concealed her illness to prevent her science from being dismissed as emotionally motivated.
Her public rebuttal was calm and evidence-based. This stark contrast—between corporate fury and her reasoned authority—galvanized the public. It sparked a grassroots awakening that became the modern environmental movement.
Policy and Paradigm Shift: From Banning DDT to a New Environmental Ethic
The book‘s impact reached the highest levels of government. President John F. Kennedy launched a presidential science advisory committee investigation. In 1963, she testified before Congress, her scientific clarity cutting through political noise.
This direct communication led to tangible policy change. The United States eventually banned DDT for agricultural use. This was a direct result of her advocacy and the public pressure she ignited.
The world context amplified her message. The Cold War created a mindset of invisible threats. Carson’s framing of chemical peril resonated with this vigilance. Simultaneously, the use of Agent Orange in the Vietnam War exemplified the global “war against nature” she condemned.
The paradigm shift was profound. The ideology of total control, born from post-World War II triumphalism, was challenged. It was challenged by a woman using that era’s own tools of science and communication.
The ultimate institutional legacy was the creation of the U.S. Environmental Protection Agency in 1970. Silent Spring provided the ethical blueprint for its mission. It established a new framework for assessing environmental risk.
Key Events: From Publication to Policy (1962-1970)
| Year | Event | Outcome |
|---|---|---|
| 1962 | Silent Spring published | National bestseller; public alarm raised about pesticides. |
| 1963 | Carson’s Congressional testimony | Science directly influences federal policy review. |
| 1963-1972 | Scientific review & public campaign | Mounting evidence leads to regulatory action. |
| 1970 | EPA established | New federal agency created to manage environmental risks. |
| 1972 | DDT banned in the U.S. | Landmark regulatory victory stemming directly from the book‘s thesis. |
The years following 1962 created a new playbook for citizen action. It combined science, litigation, and advocacy to hold power accountable. Rachel Carson‘s quiet study had sparked an unfinished revolution.
4. Carson’s Enduring Framework: Her Vision and the 2030 UN Sustainable Development Goals

Today’s global sustainability agenda, codified in the UN’s 17 goals, finds a profound precursor in the systemic vision of a mid-century science writer. The Sustainable Development Goals (SDGs) are the modern operational plan for a viable planet. Their ethical and ecological DNA, however, was articulated decades earlier.
Her philosophy was built on several core tenets. These ideas now form the bedrock of integrated global policy.
- Interconnectedness of all life systems.
- Moral duty to future generations.
- The public’s right to know about hazards.
- The precautionary principle for new technologies.
- A critique of unchecked economic growth.
This framework refuses to separate planetary health from human justice. It makes her the unacknowledged architect of the SDG structure.
Direct Environmental Stewardship: Goals for Planet
The “Planet” cluster of SDGs (6, 13, 14, 15) has a direct lineage to her research. Her book Silent Spring exposed the poisoning of waterways by agricultural chemicals. This established the scientific urgency for SDG 6: Clean Water and Sanitation.
Her sea trilogy documented atmospheric and oceanic changes. She warned of rising sea levels and collapsing populations. These observations presaged SDG 13: Climate Action and SDG 14: Life Below Water.
Her critique of pesticides like DDT highlighted the collapse of bird populations. It framed terrestrial protection as a survival issue. This moral argument underpins SDG 15: Life on Land.
Foundations for Health, Equity, and Justice: Goals for People
The “People” goals address poverty, health, and inequality. Carson’s work indirectly targeted these root causes. She linked environmental pollution directly to public health, a core of SDG 3: Good Health.
The Silent Spring Institute continues this legacy. It has identified over 900 potential breast cancer-causing chemicals. This ongoing research validates her early warnings and fuels modern advocacy.
Her mission to educate the public embodied SDG 4: Quality Education. She believed informed citizens were essential for change. Furthermore, her success as a woman in a male-dominated field challenged power structures, aligning with SDG 5: Gender Equality.
Enabling Sustainable Systems: Goals for Prosperity and Partnership
Her foresight extended to economic and social models. The “Prosperity” goals seek sustainable industry, energy, and cities. Carson’s critique of irresponsible industry prefigured this need.
She questioned a growth model that sacrificed the natural world. This critique aligns with SDG 8: Decent Work and Economic Growth and SDG 12: Responsible Consumption. It calls for systems that do not externalize their dangers.
The final “Partnership” goals (16 & 17) require transparent governance and collaboration. Her reliance on scientific networks modeled multi-stakeholder action. Her demand for accountable government echoes SDG 16: Peace, Justice, and Strong Institutions.
Mapping Carson’s Core Tenets to the SDG Framework
| Carson’s Principle | SDG Cluster | Modern Manifestation |
|---|---|---|
| Interconnectedness | Planet (14, 15) | Integrated ecosystem management policies. |
| Public’s Right to Know | People (3, 4) | Community right-to-know laws and health education. |
| Precautionary Principle | Prosperity (9, 12) | Regulations on novel materials and chemicals. |
| Critique of Unchecked Growth | Partnership (17) | Global partnerships for sustainable development. |
The relationship is bilateral. Her work informed the goals’ creation. Now, the pursuit of these goals extends her unfinished revolution.
It is deeply ironic. The world is now codifying objectives she identified as necessary over half a century ago. This underscores the protracted pace of institutional change. The vision of Rachel Carson was inherently systemic. It remains the blueprint for a livable future.

5. Conclusion: The Rachel Carson Legacy – Disciples, Movement, and an Unfinished Revolution
Immediate collaborators and later disciples have carried forward the crucial work begun in the mid-20th century. Allies like Shirley Briggs provided vital research for Silent Spring, forming its intellectual core.
This effort spurred tangible government action, including the founding of the U.S. Environmental Protection Agency. The environmental movement she ignited now thrives through organizations and advocates worldwide.
Scientific successors, such as the Silent Spring Institute, continue probing links between chemicals and cancer. Yet, with many pesticides like DDT banned but thousands of novel compounds untested, her revolution remains unfinished.
Rachel Carson‘s legacy endures as a living call for precaution and informed public stewardship. It is a blueprint still guiding the quest for a healthier planet.

Key Takeaways
- Rachel Carson’s work in the mid-20th century launched the modern environmental movement by making science accessible to the public.
- Her unique background as both a scientist and a writer allowed her to effectively communicate complex ecological concepts.
- Silent Spring was instrumental in shifting public policy and raising awareness about the dangers of pesticides.
- As a woman in STEM during the 1950s and 60s, she overcame significant gender barriers in science and government.
- Her advocacy established the principle of the public’s right to know about environmental hazards.
- Carson’s vision of ecological interconnectedness directly informs contemporary frameworks like the UN Sustainable Development Goals.
- Her legacy demonstrates how a single, powerful voice can challenge industrial norms and inspire global change.